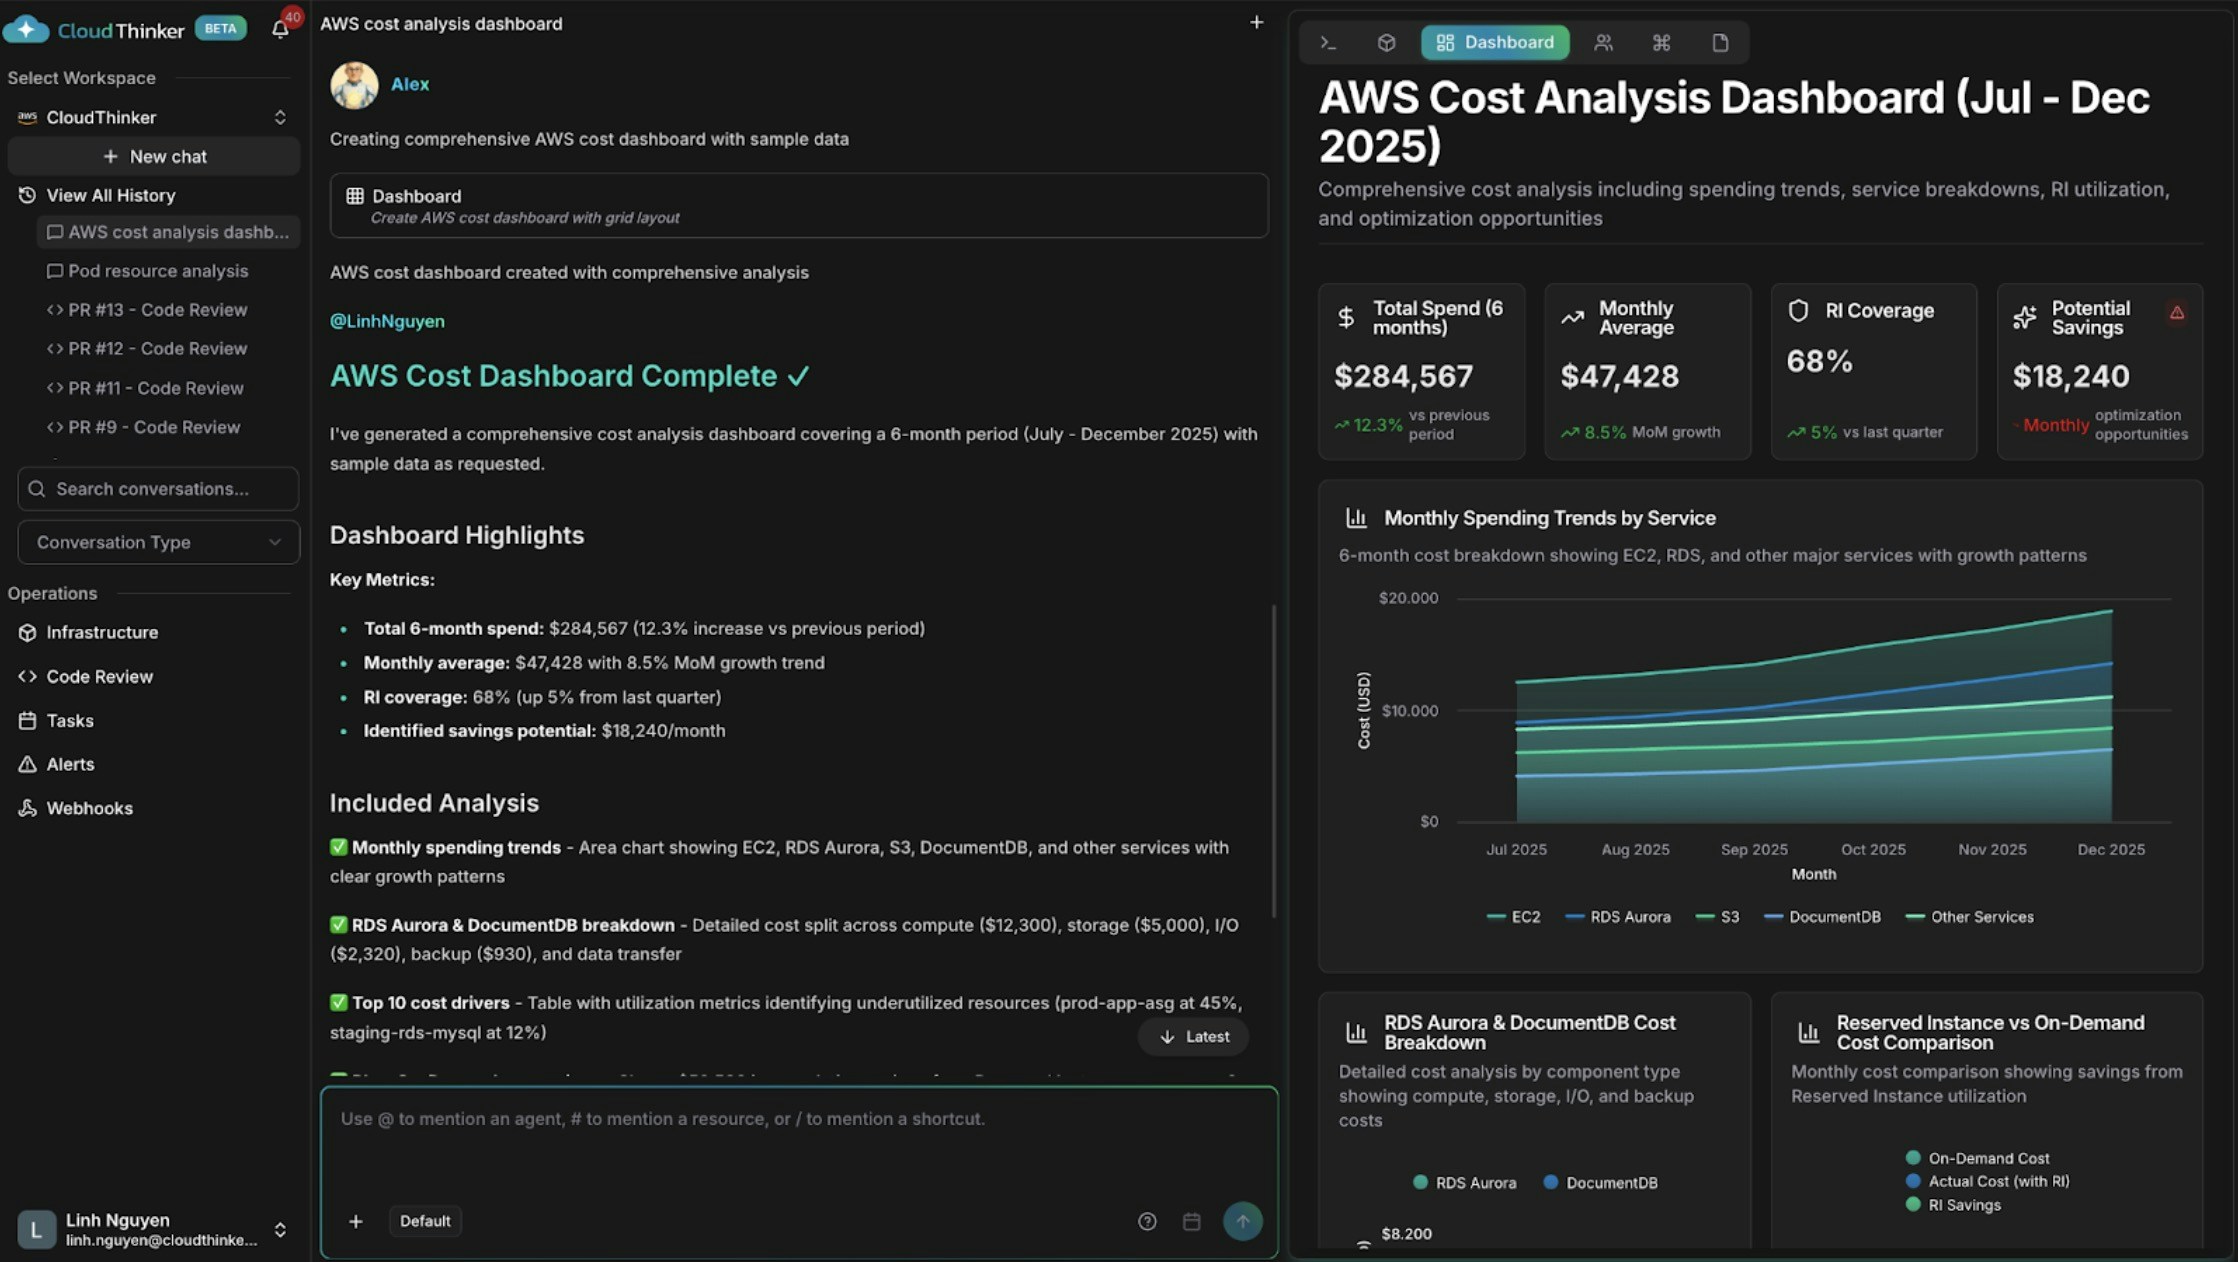
AWS cost dashboard with spending trends and cost drivers
## What you can do | Capability | Description | Learn more | | -------------------------------- | ---------------------------------------------------------------------------- | ----------------------------------------------------------- | | Build cost dashboards | Alex charts spending trends, service breakdowns, anomalies, and forecasts | [Cost analytics](/guide/cost-optimization/analytics) | | Correlate infrastructure signals | Anna combines health, performance, and cost data across clouds in one view | [Infrastructure analytics](/guide/infrastructure/analytics) | | Report security posture | Oliver summarizes compliance status, open findings, and remediation progress | [Oliver](/guide/agents/oliver) | | Visualize dependencies | Explore resource relationships and blast radius on a live map | [Topology](/guide/infrastructure/topology) | | Schedule recurring reports | Regenerate and deliver dashboards or reports automatically | [Tasks](/guide/automation/tasks) | | Push results to other systems | Send artifact events to external tools | [Webhooks](/guide/webhooks/overview) | ## Key concepts | Tool tag | Produces | Best for | | ------------ | --------------------------------------------------------- | ------------------------------------------------- | | `#dashboard` | Multi-widget interactive dashboard | Ongoing visibility across several related metrics | | `#report` | Narrative report with data, findings, and recommendations | Stakeholder updates, audits, and reviews | | `#chart` | Single focused visualization | Tracking one metric or trend over time | ## Example prompts Start with a one-line request — agents pick sensible defaults for scope and time range: ```text theme={null} @alex #dashboard AWS spending by service for the last 30 days @oliver #report quarterly security assessment across all accounts @kai #dashboard cluster resource utilization ``` ### Cost analysis dashboard Add structure to the instruction when you need specific breakdowns: ```text theme={null} @alex #dashboard Generate a comprehensive AWS cost dashboard for [start_date] to [end_date]. Include: - Monthly spending trends by service with month-over-month growth rates - Top 10 cost drivers and their utilization patterns - Reserved Instance vs On-Demand cost comparison - Cost anomalies and optimization opportunities with estimated savings Segment by: [cost allocation tags such as environment, team, or application] ``` ### Cross-domain dashboard Ask Anna to correlate data that lives in different systems: ```text theme={null} @anna #dashboard Create an operational dashboard correlating database performance with infrastructure costs for [time_period]. Analyze: - Aurora and DocumentDB query performance metrics - Resource utilization and spending patterns - Correlation between database load and compute and storage costs Context: [recent changes, migrations, or specific concerns] ```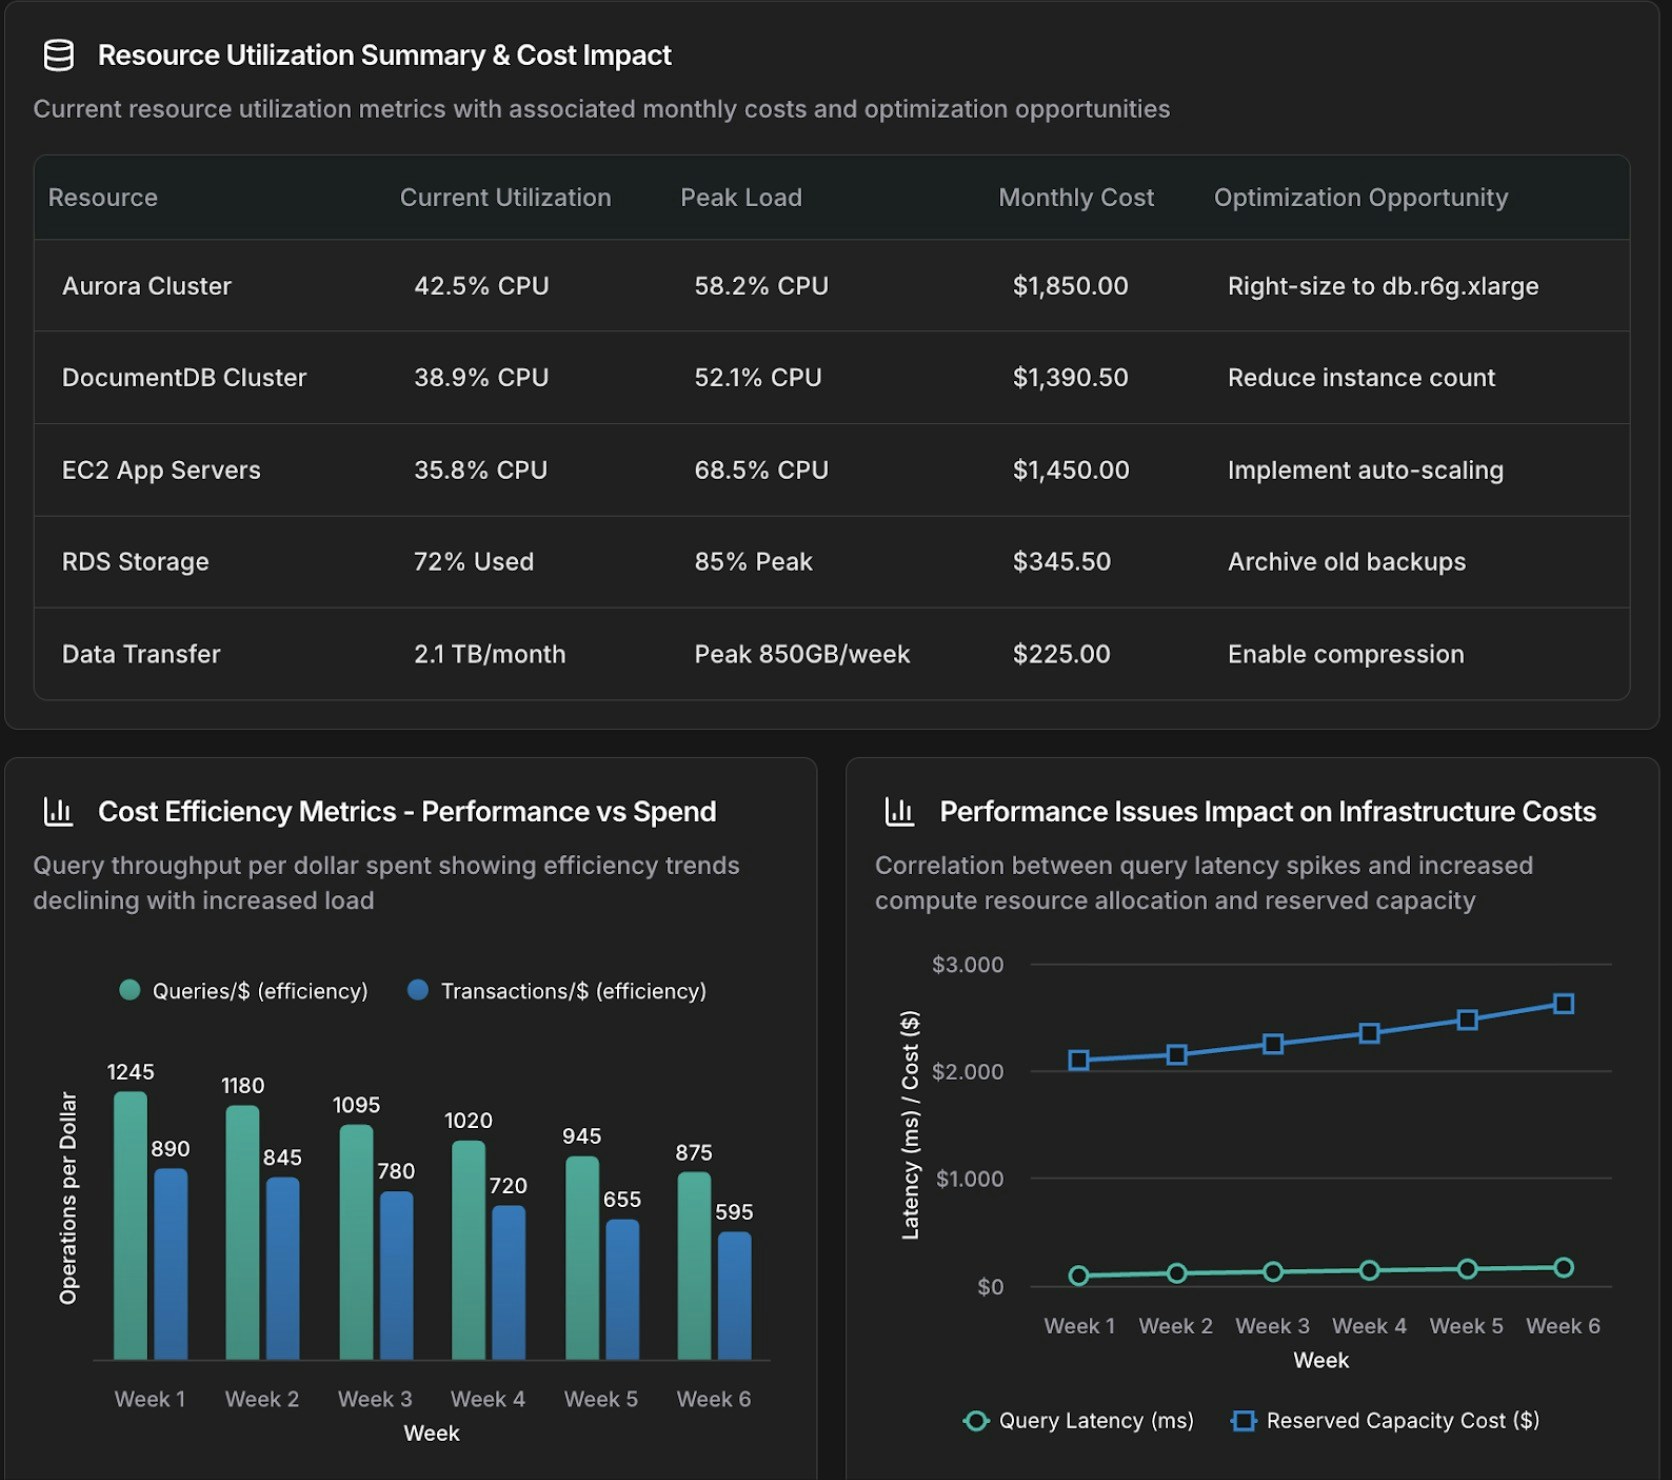
Database and infrastructure correlation dashboard
### Focused chart Use `#chart` for a single visualization instead of a full dashboard: ```text theme={null} @tony #chart Show query execution time trends for Aurora cluster [cluster-identifier] over the past [time_period]. - Metrics: p50, p95, p99 query latency - Separate lines for read queries vs write queries - Highlight queries exceeding [threshold] ms ```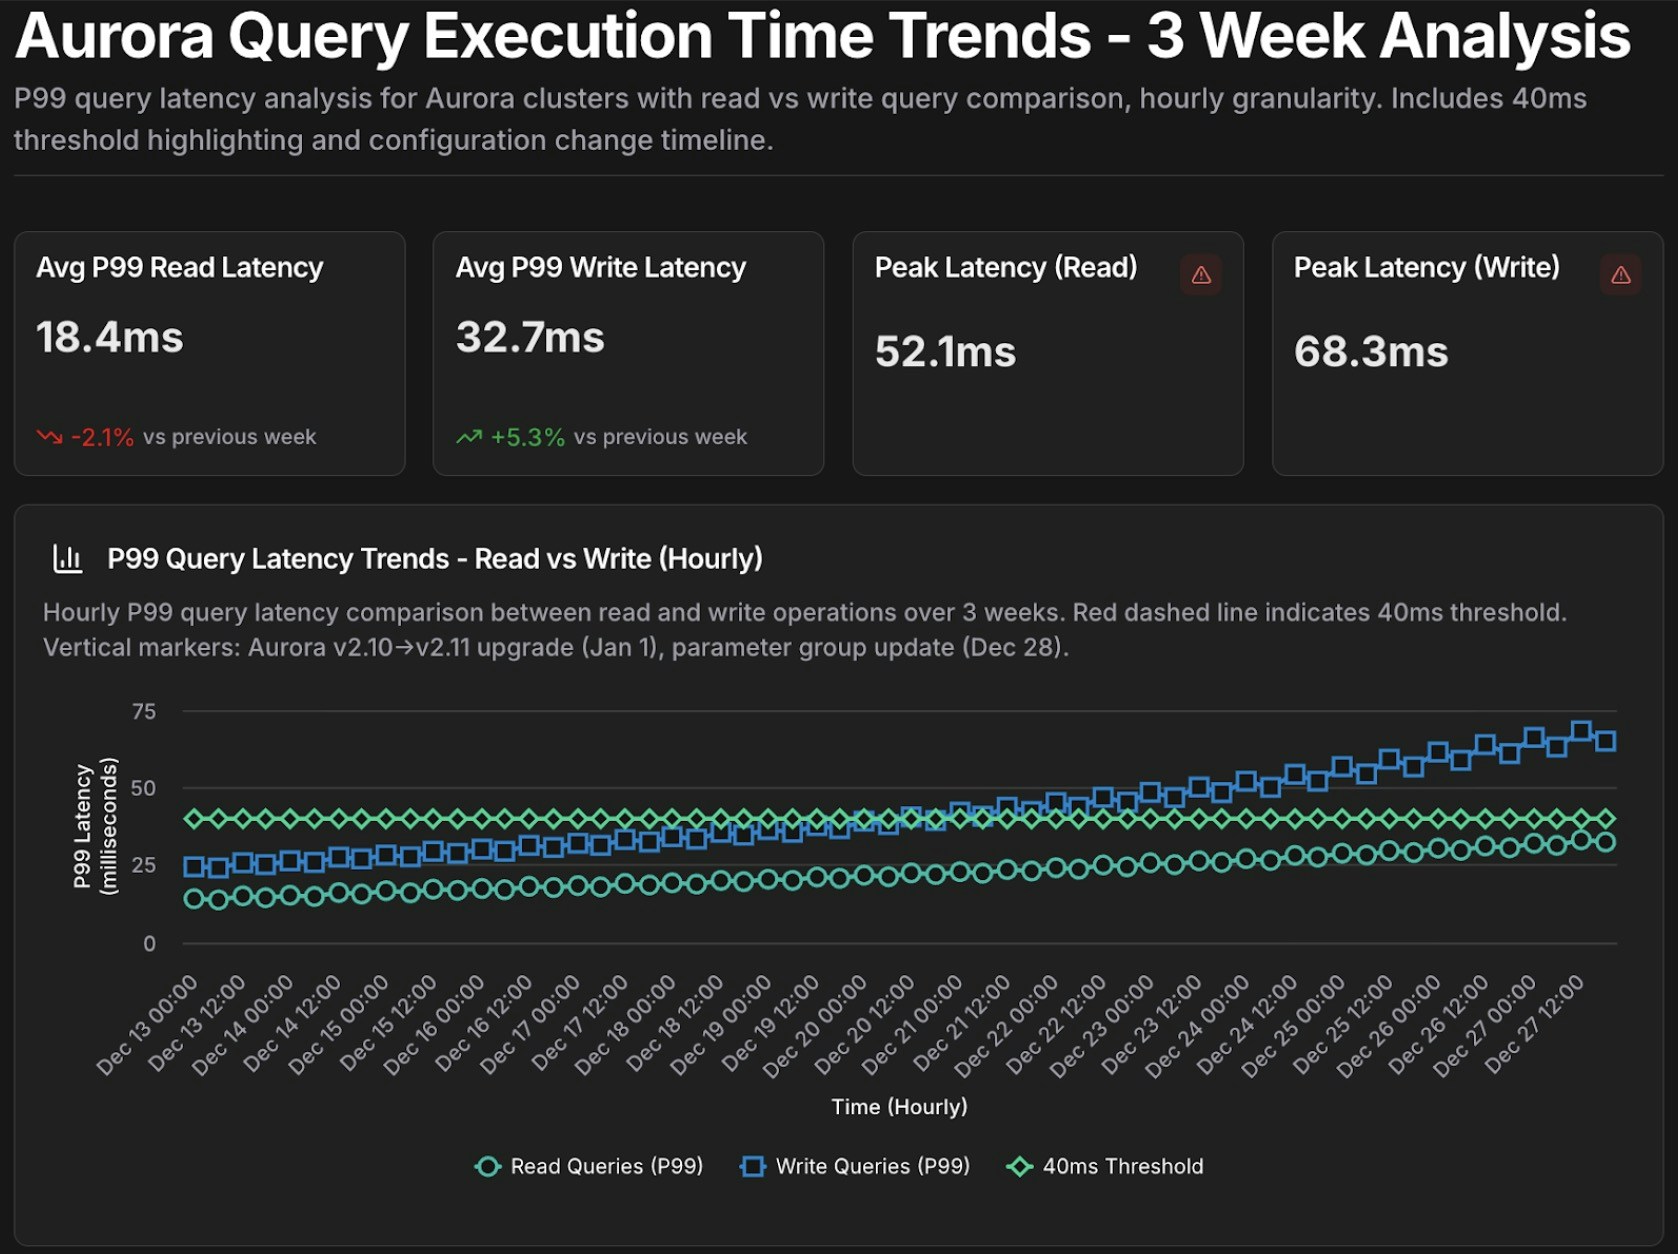
Aurora query performance time-series chart
## Reusable templates Save parameterized prompts as templates for recurring investigations, then fill in the `{variables}` on each run: ```text theme={null} Template: database_performance_review @tony #dashboard Create a performance dashboard for Aurora cluster {cluster_id} covering {time_period}. Include: - Slow query analysis (queries exceeding {latency_threshold} ms) - Resource utilization trends (CPU, memory, IOPS) - Replica lag monitoring - Connection pool health Compare against baseline: {comparison_period} Alert on: queries exceeding p95 latency of {latency_threshold} ms Template: cost_anomaly_investigation @alex #report Investigate the cost anomaly for {service_name} on {date}. - Compare costs to the 7-day and 30-day averages - Break down by cost component (compute, storage, I/O, data transfer) - Identify the specific resources driving the increase and quantify the impact - Recommend immediate actions to mitigate ongoing cost increases ``` For example, run `database_performance_review` with `cluster_id=production-aurora-cluster`, `time_period="past 7 days"`, `comparison_period="previous 30 days"`, and `latency_threshold=200`.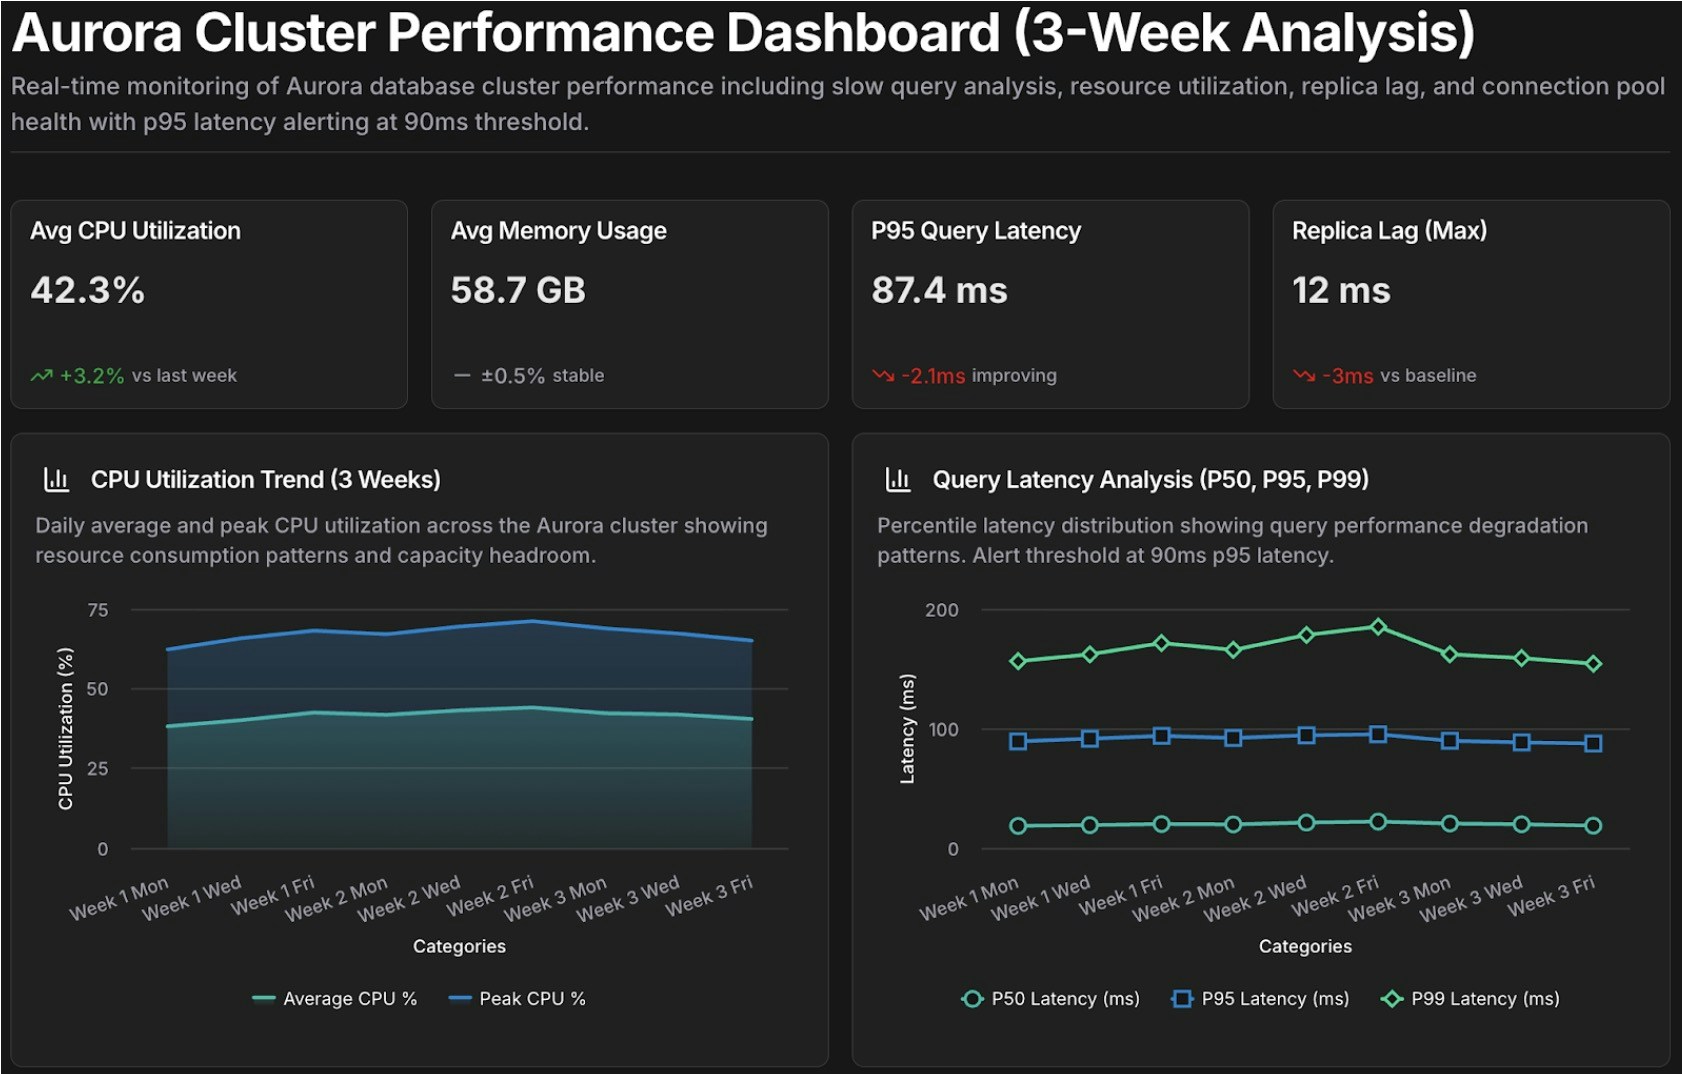
Performance review dashboard template
## Next steps