> ## Documentation Index
> Fetch the complete documentation index at: https://docs.cloudthinker.io/llms.txt
> Use this file to discover all available pages before exploring further.
# Topology
> Map cloud infrastructure dependencies visually and trace incidents back to their root cause with the Topology Explorer
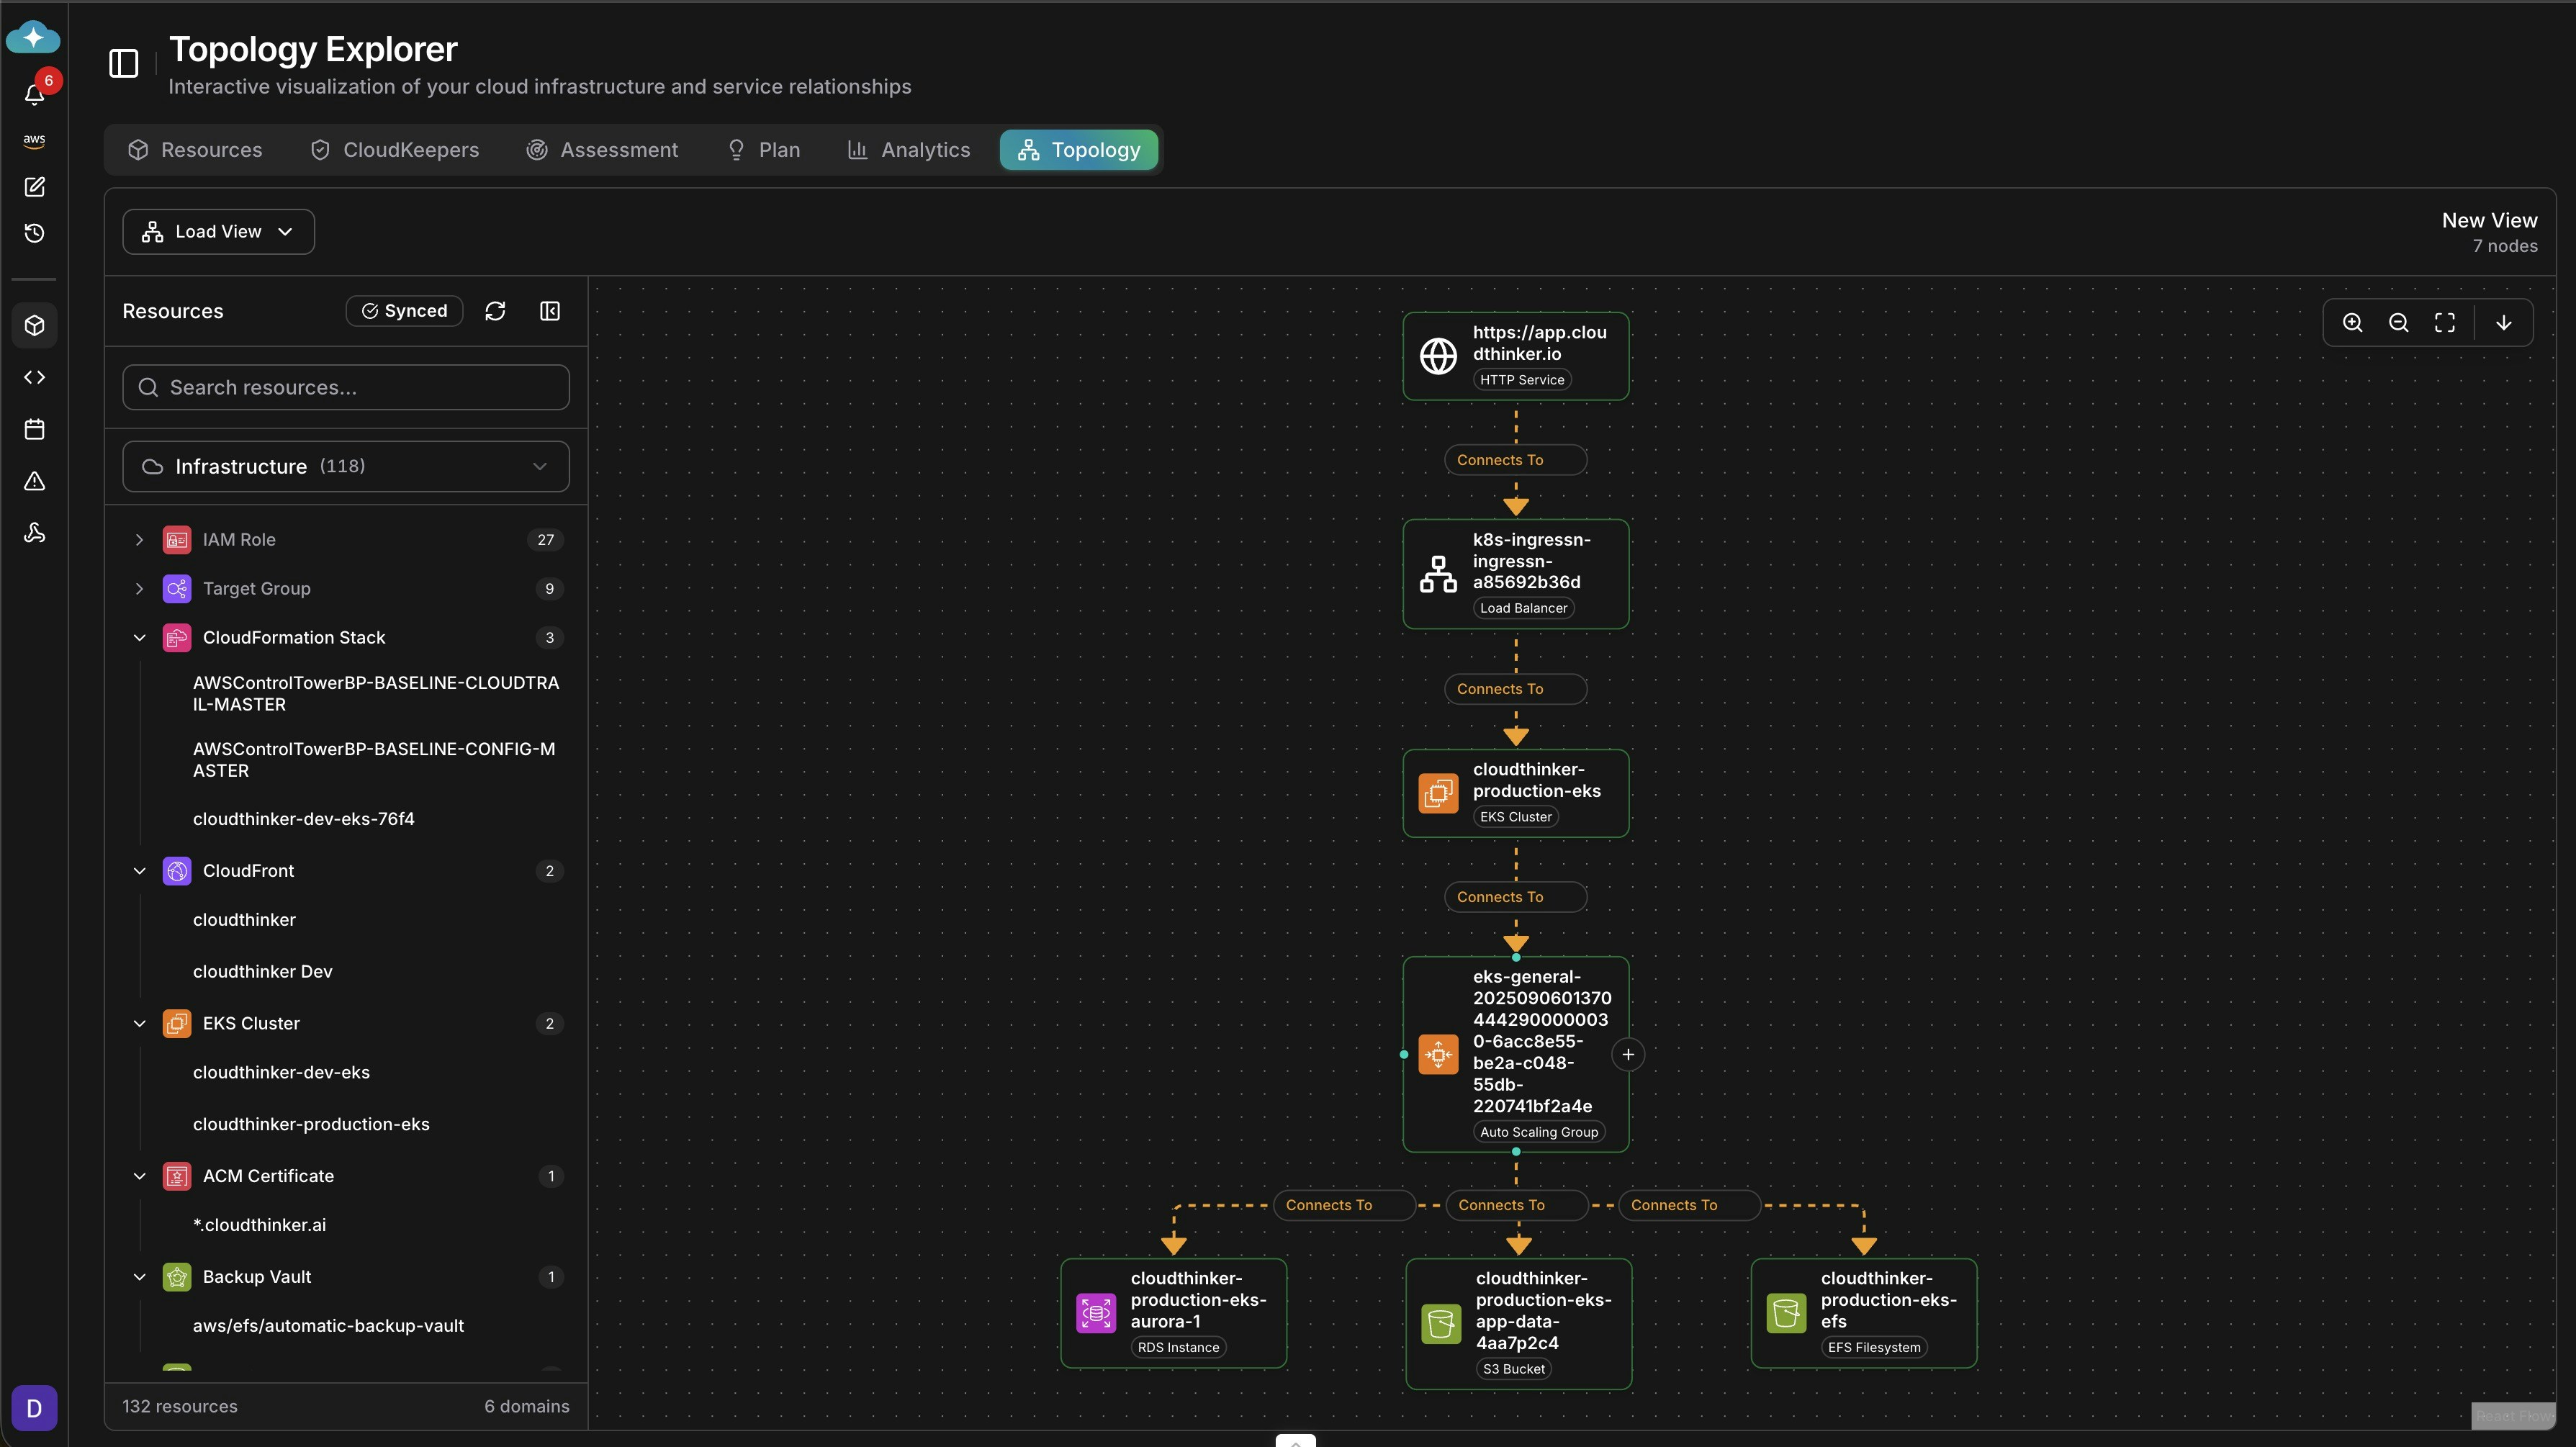
The Topology Explorer renders your cloud infrastructure and service relationships as an interactive map. Let agents discover the map from live cloud APIs, import it from Infrastructure as Code, or build it by hand.
 ## Build a topology map
Ask an agent to discover resources and relationships directly from your connected cloud accounts. The map stays synced as your infrastructure changes.
```text theme={null}
@alex discover and map the infrastructure topology for the production AWS account
@kai map Kubernetes service dependencies in the main cluster
```
Discovery requires an active [connection](/guide/connections/overview) for each provider you want mapped.
Import topology from Terraform state, CloudFormation stack templates, or Pulumi state files.
Go to **Infrastructure → Topology**.
Select **New View → Import from IaC**.
Pick Terraform State, CloudFormation, or another supported format.
Upload the state file, or connect to a remote state backend.
**Success state:** the imported resources and their relationships appear on the canvas.
Build a map by hand when you want a curated view — an onboarding diagram, for example.
Click **New View** in the Topology Explorer.
Drag resources from the left panel onto the canvas.
Click and drag between resources to create relationships.
Name and save your topology view.
## Resource types
The Topology Explorer supports all major cloud resource types:
| Category | Resources |
| ---------- | -------------------------------------------- |
| Compute | EC2, Lambda, ECS, EKS, VMs, Cloud Run |
| Networking | VPC, load balancers, CloudFront, API Gateway |
| Database | RDS, Aurora, DynamoDB, Cloud SQL |
| Storage | S3, EFS, EBS, Cloud Storage |
| Security | IAM roles, security groups, ACM certificates |
| Kubernetes | Clusters, deployments, services, pods |
## Views, filters, and export
| Control | What it does |
| ----------------------- | ----------------------------------------------------------------------------------------- |
| **Load View** dropdown | Opens a saved topology view |
| Search and filter panel | Finds resources by name or ID; filters by type, tags, or metadata; shows/hides categories |
| **Synced** indicator | Shows when the topology was last updated from your infrastructure |
| Export | Saves the view as PNG/SVG, PDF, or JSON, or generates a share link |
## How agents use topology
Every agent can read the topology map and reason over dependency paths:
| Agent | Topology usage |
| ------------------------------ | --------------------------------------------------------- |
| [Alex](/guide/agents/alex) | Cost impact visualization, resource optimization paths |
| [Oliver](/guide/agents/oliver) | Security exposure mapping, compliance visualization |
| [Tony](/guide/agents/tony) | Database dependency chains, performance bottlenecks |
| [Kai](/guide/agents/kai) | Service mesh visualization, pod relationships |
| [Anna](/guide/agents/anna) | Cross-service incident coordination, architecture reviews |
## Topology-driven RCA
Topology speeds up [root cause analysis](/guide/incident/root-cause-analysis) because most incidents originate in a dependency, not in the service that alerted. Here is a worked example.
**The alert:** checkout success rate drops to 60%. Checkout logs show scattered timeouts, but the payment service, database, and cache all report healthy.
1. Start from the alert, not from logs. Center the map on the alerting service with health overlaid:
```text theme={null}
@alex show the topology centered on checkout-service with health status overlaid
```
2. Trace upstream. The map shows the dependency chain checkout service → payment gateway → external payment API — and the external API node is marked degraded.
3. Confirm with metrics and rule out recent changes before acting:
```text theme={null}
@alex overlay latency and error-rate metrics on this topology view
@alex show topology changes in the last 24 hours
```
Alex shows timeouts concentrated on the gateway-to-external-API edge, with no recent deployments on the payment path — confirming the third-party provider as the origin.
4. Resolve and document. Fail over to the backup payment provider, then export a topology snapshot for the [incident record](/guide/incident/manual-logging) and postmortem.
### Reading a cascading failure
When several services fail at once, the topology timeline view shows the origin and the propagation order in a single view, instead of each team investigating its own service. In this cascade, every downstream failure traces back to one expired SSL certificate:
| Time | Service | Status | Cause |
| -------- | --------------- | ------ | ----------------------- |
| 10:00:00 | Auth service | Failed | SSL certificate expired |
| 10:00:05 | User service | Failed | Cannot validate tokens |
| 10:00:08 | Order service | Failed | Auth dependency |
| 10:00:10 | Payment service | Failed | Auth dependency |
| 10:00:15 | All services | Failed | Cascade complete |
Build your topology and connect health data sources before an incident. A pre-built, synced map is what makes the first step take seconds instead of minutes.
## Other things to ask
* `@alex show downstream dependencies of payment-service` — check blast radius before a risky change
* `@oliver map all connections from instance i-0abc123` — scope security exposure during an investigation
* `@tony map every service connecting to the production database` — find the source of connection exhaustion
* `@kai show service dependencies and single points of failure in the cluster` — harden Kubernetes reliability
* `@alex compare the production topology with the DR region and list missing resources` — validate disaster recovery coverage
## Related
View all discovered infrastructure resources
Run agent-led RCA on incidents
Run infrastructure assessments
## Build a topology map
Ask an agent to discover resources and relationships directly from your connected cloud accounts. The map stays synced as your infrastructure changes.
```text theme={null}
@alex discover and map the infrastructure topology for the production AWS account
@kai map Kubernetes service dependencies in the main cluster
```
Discovery requires an active [connection](/guide/connections/overview) for each provider you want mapped.
Import topology from Terraform state, CloudFormation stack templates, or Pulumi state files.
Go to **Infrastructure → Topology**.
Select **New View → Import from IaC**.
Pick Terraform State, CloudFormation, or another supported format.
Upload the state file, or connect to a remote state backend.
**Success state:** the imported resources and their relationships appear on the canvas.
Build a map by hand when you want a curated view — an onboarding diagram, for example.
Click **New View** in the Topology Explorer.
Drag resources from the left panel onto the canvas.
Click and drag between resources to create relationships.
Name and save your topology view.
## Resource types
The Topology Explorer supports all major cloud resource types:
| Category | Resources |
| ---------- | -------------------------------------------- |
| Compute | EC2, Lambda, ECS, EKS, VMs, Cloud Run |
| Networking | VPC, load balancers, CloudFront, API Gateway |
| Database | RDS, Aurora, DynamoDB, Cloud SQL |
| Storage | S3, EFS, EBS, Cloud Storage |
| Security | IAM roles, security groups, ACM certificates |
| Kubernetes | Clusters, deployments, services, pods |
## Views, filters, and export
| Control | What it does |
| ----------------------- | ----------------------------------------------------------------------------------------- |
| **Load View** dropdown | Opens a saved topology view |
| Search and filter panel | Finds resources by name or ID; filters by type, tags, or metadata; shows/hides categories |
| **Synced** indicator | Shows when the topology was last updated from your infrastructure |
| Export | Saves the view as PNG/SVG, PDF, or JSON, or generates a share link |
## How agents use topology
Every agent can read the topology map and reason over dependency paths:
| Agent | Topology usage |
| ------------------------------ | --------------------------------------------------------- |
| [Alex](/guide/agents/alex) | Cost impact visualization, resource optimization paths |
| [Oliver](/guide/agents/oliver) | Security exposure mapping, compliance visualization |
| [Tony](/guide/agents/tony) | Database dependency chains, performance bottlenecks |
| [Kai](/guide/agents/kai) | Service mesh visualization, pod relationships |
| [Anna](/guide/agents/anna) | Cross-service incident coordination, architecture reviews |
## Topology-driven RCA
Topology speeds up [root cause analysis](/guide/incident/root-cause-analysis) because most incidents originate in a dependency, not in the service that alerted. Here is a worked example.
**The alert:** checkout success rate drops to 60%. Checkout logs show scattered timeouts, but the payment service, database, and cache all report healthy.
1. Start from the alert, not from logs. Center the map on the alerting service with health overlaid:
```text theme={null}
@alex show the topology centered on checkout-service with health status overlaid
```
2. Trace upstream. The map shows the dependency chain checkout service → payment gateway → external payment API — and the external API node is marked degraded.
3. Confirm with metrics and rule out recent changes before acting:
```text theme={null}
@alex overlay latency and error-rate metrics on this topology view
@alex show topology changes in the last 24 hours
```
Alex shows timeouts concentrated on the gateway-to-external-API edge, with no recent deployments on the payment path — confirming the third-party provider as the origin.
4. Resolve and document. Fail over to the backup payment provider, then export a topology snapshot for the [incident record](/guide/incident/manual-logging) and postmortem.
### Reading a cascading failure
When several services fail at once, the topology timeline view shows the origin and the propagation order in a single view, instead of each team investigating its own service. In this cascade, every downstream failure traces back to one expired SSL certificate:
| Time | Service | Status | Cause |
| -------- | --------------- | ------ | ----------------------- |
| 10:00:00 | Auth service | Failed | SSL certificate expired |
| 10:00:05 | User service | Failed | Cannot validate tokens |
| 10:00:08 | Order service | Failed | Auth dependency |
| 10:00:10 | Payment service | Failed | Auth dependency |
| 10:00:15 | All services | Failed | Cascade complete |
Build your topology and connect health data sources before an incident. A pre-built, synced map is what makes the first step take seconds instead of minutes.
## Other things to ask
* `@alex show downstream dependencies of payment-service` — check blast radius before a risky change
* `@oliver map all connections from instance i-0abc123` — scope security exposure during an investigation
* `@tony map every service connecting to the production database` — find the source of connection exhaustion
* `@kai show service dependencies and single points of failure in the cluster` — harden Kubernetes reliability
* `@alex compare the production topology with the DR region and list missing resources` — validate disaster recovery coverage
## Related
View all discovered infrastructure resources
Run agent-led RCA on incidents
Run infrastructure assessments