> ## Documentation Index
> Fetch the complete documentation index at: https://docs.cloudthinker.io/llms.txt
> Use this file to discover all available pages before exploring further.
# Pulse Setup
> Wire AWS pollers, chat channels, and monitoring webhooks into Pulse so actionable clusters escalate to incidents
Pulse pulls signals from three source families — AWS service pollers, chat platforms (Slack and Teams), and third-party monitoring webhooks — all configured from the **Manage subscriptions** page. Once a source is wired, Pulse deduplicates and classifies every event, and clusters that cross the actionability bar escalate to an [incident](/guide/incident/overview) where agents investigate root cause.
## Prerequisites
* A CloudThinker workspace — new to Pulse? Read [How it works](/guide/pulse/overview) first
* An active [AWS connection](/guide/connections/aws) with read permissions for the services you want to poll
* The CloudThinker bot installed in [Slack](/guide/slack-integration) or [Teams](/guide/teams-integration), if you want chat-channel signals
* A monitoring tool that supports outbound webhooks, if you want third-party signals
## Wire monitoring into incidents
This is the end-to-end flow: connect a source, confirm signals arrive, and let actionable clusters escalate to incidents.
Go to **Pulse** in your workspace and click **Manage subscriptions**. The page lists all three source families and their current status.
Enable an AWS poller, subscribe a chat channel, or point a monitoring webhook at CloudThinker — the three procedures below cover each path.
Send a test alert from your monitoring tool, or wait for the next polling cycle.
**Success state:** new signals appear in the Pulse feed with a category, severity, and one-line summary.
Pulse auto-escalates [clusters](/guide/pulse/clusters) with Critical or High severity signals, or any signal the AI marks actionable. For anything else, click **Escalate** on the cluster.
**Success state:** a linked incident is created and [root cause analysis](/guide/incident/root-cause-analysis) begins with the cluster's full signal history as starting context.
## AWS polling
AWS polling lets Pulse pull events directly from your AWS accounts on a schedule — no webhook configuration required. Each source is enabled per connection.
| Source | What Pulse collects | Cadence |
| ------------------- | ------------------------------------------------------------------------- | ------------- |
| **CloudTrail** | API call audit logs — who did what, when, on which resource | Every 5 min |
| **AWS Health** | Service health events impacting your account or region | Every 5 min |
| **Cost Anomaly** | Spend spikes detected by AWS Cost Anomaly Detector | Every 6 hours |
| **GuardDuty** | Threat intelligence findings — compromised instances, suspicious behavior | Periodic |
| **Config** | Resource configuration drift against Config rules | Periodic |
| **Access Analyzer** | IAM and S3 access findings — overly permissive or public resources | Periodic |
### Enable a poller
In Pulse, click **Manage subscriptions** and go to the **AWS Polling** section. You see your connected AWS accounts and their current polling status.
Click **Validate** next to the source. Pulse performs a dry run to confirm your credentials have the required read permissions.
**Success state:** a clear ✓ means ready; an error code (e.g. `AccessDenied`) tells you exactly what's missing.
Toggle the source on. Pulse starts polling immediately.
If a poller fails five consecutive times, Pulse pauses it automatically and surfaces the error code. To resume: fix the issue, re-validate, then re-enable the toggle.
## Slack and Teams subscriptions
When the CloudThinker bot is present in a channel, messages in that channel become Pulse signals — alert bot posts, incident announcements, on-call chatter — classified alongside your infrastructure events.
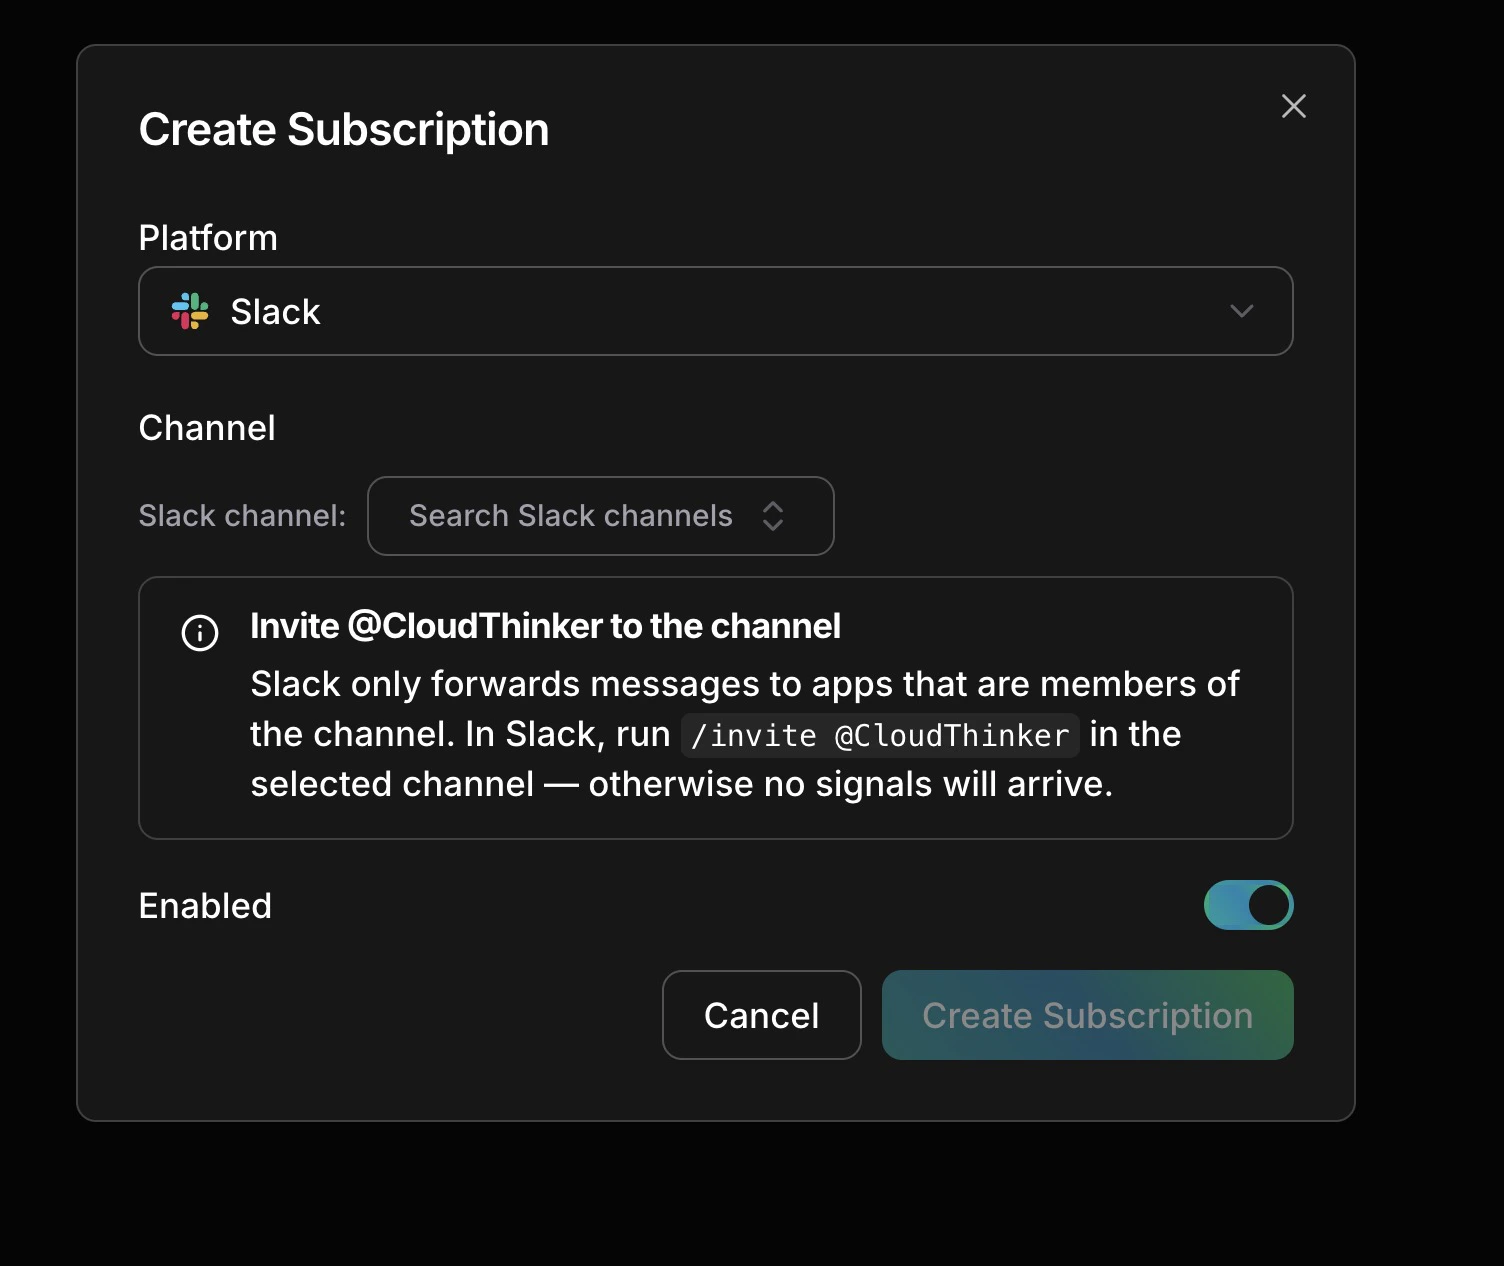
Select a platform, pick a channel, invite the bot, save
Choose **Slack** or **Microsoft Teams**.
Search for the channel you want to monitor.
Run `/invite @CloudThinker` in the target channel — Slack only delivers messages to apps that are channel members.
**Enabled** is on by default. Click **Create subscription**.
Subscriptions can be toggled on and off independently — useful for muting a channel during a maintenance window without losing the configuration.
### Channel types
| Type | Best for |
| ------------------- | ------------------------------------------------------------- |
| **Alert** | Channels used exclusively for automated alert bots |
| **Communication** | Channels used for human discussion — incident chats, handoffs |
| **Mixed** (default) | Channels with both automated alerts and human messages |
## Third-party webhooks
Any monitoring tool that supports outbound webhooks can send signals to Pulse — Datadog, Grafana, PagerDuty, and more ship with built-in field mapping.
Go to **Webhooks** in CloudThinker and create an endpoint — see [Webhooks](/guide/webhooks/overview) for full setup.
Paste the generated URL into your tool's webhook or notification settings. Platform-specific instructions, authentication options, and field mappings live in [Webhook integrations](/guide/incident/webhook-integrations/overview).
Use your monitoring tool's test feature.
**Success state:** the alert appears as a signal in the Pulse feed within moments.
## Signal categories
Every signal — regardless of source — is assigned one of eight categories:
| Category | Examples |
| ----------------- | --------------------------------------------------------------- |
| **Compute** | EC2 status, Lambda timeouts, ECS failures, container restarts |
| **Network** | NAT gateway anomalies, CloudFront degradation, VPC changes |
| **Security** | GuardDuty findings, IAM changes, S3 public access, WAF triggers |
| **Cost** | Cost anomalies, idle resources, Savings Plan drops, RI expiry |
| **Data** | RDS connection issues, S3 operations, database events |
| **Deploy** | CodeDeploy, ECS rollouts, CloudFormation stack changes |
| **Communication** | Slack and Teams messages, alert bot notifications |
| **Unclassified** | Default until the AI classifier assigns a category |
## Next steps
Triage the cluster lifecycle — from Active to Routed to Resolved
Platform-specific setup for Datadog, Grafana, PagerDuty, and more
See how agents investigate escalated incidents to a confident root cause
Measure noise reduction and signal trends across your sources