> ## Documentation Index
> Fetch the complete documentation index at: https://docs.cloudthinker.io/llms.txt
> Use this file to discover all available pages before exploring further.
# Kubernetes Health Monitoring
> Use Kai to monitor EKS cluster health, surface resource waste, and get HPA recommendations before problems reach production.
Kai monitors your Amazon EKS cluster continuously, surfacing over-provisioned pods, underutilized nodes, and missing autoscaling policies before they cause outages.
## The scenario
A platform team runs a production EKS cluster across several namespaces. CPU alerts are intermittent but investigation is slow—engineers run manual `kubectl` commands across hundreds of pods to correlate logs, metrics, and events.
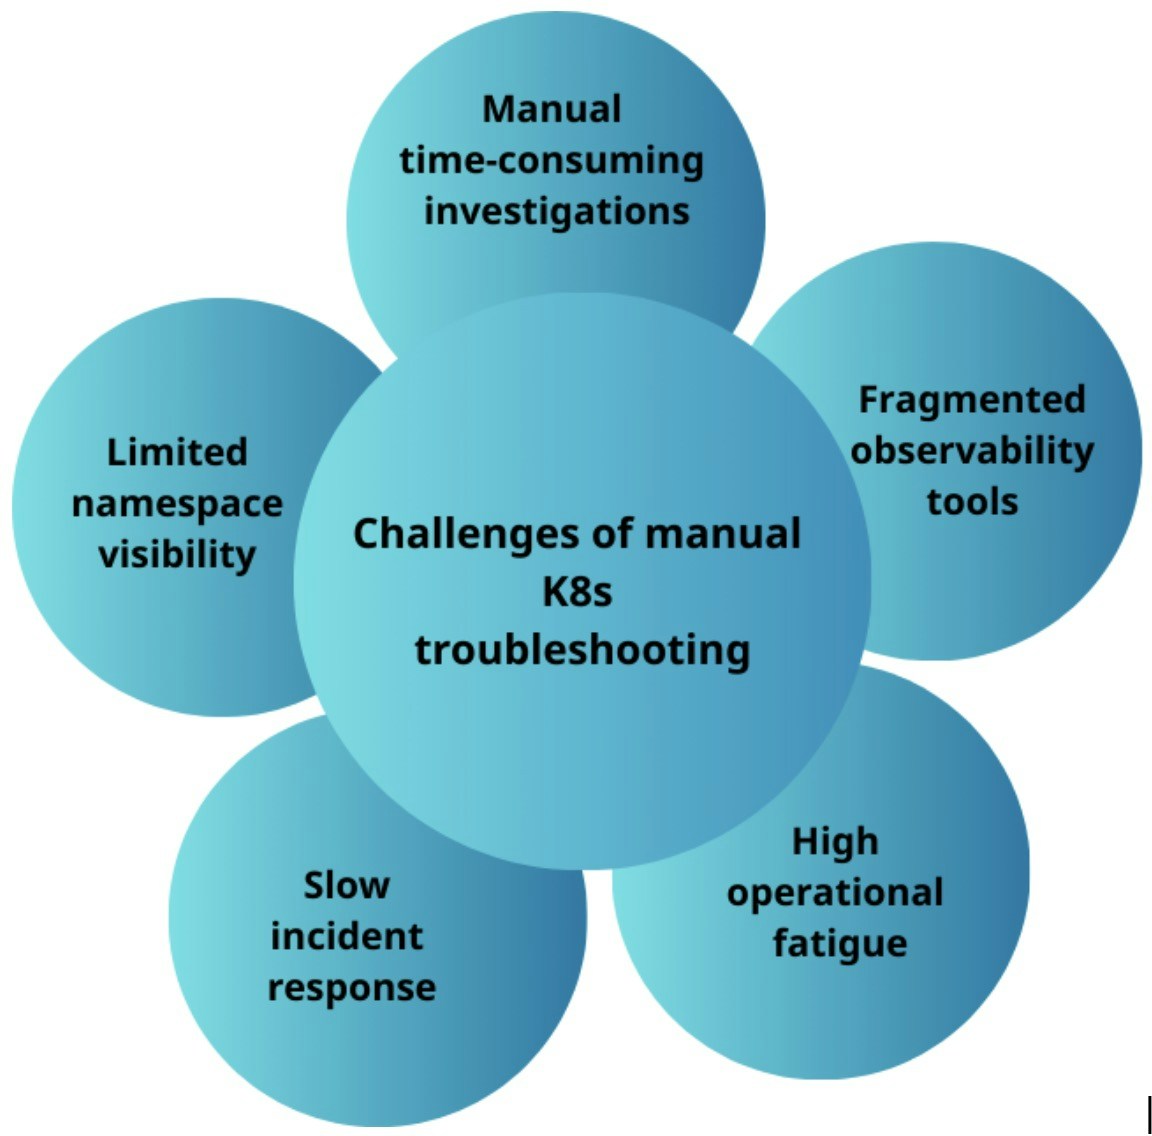
Manual Kubernetes troubleshooting challenges
The team asks Kai to assess the cluster end-to-end, identify resource waste, and recommend autoscaling policies where they are missing.
## Walkthrough
### Connect Kai to your cluster
Follow the [Kubernetes connection guide](/guide/connections/kubernetes) to give Kai access to your EKS cluster. Once the connection shows **Connected**, Kai can query the cluster directly.
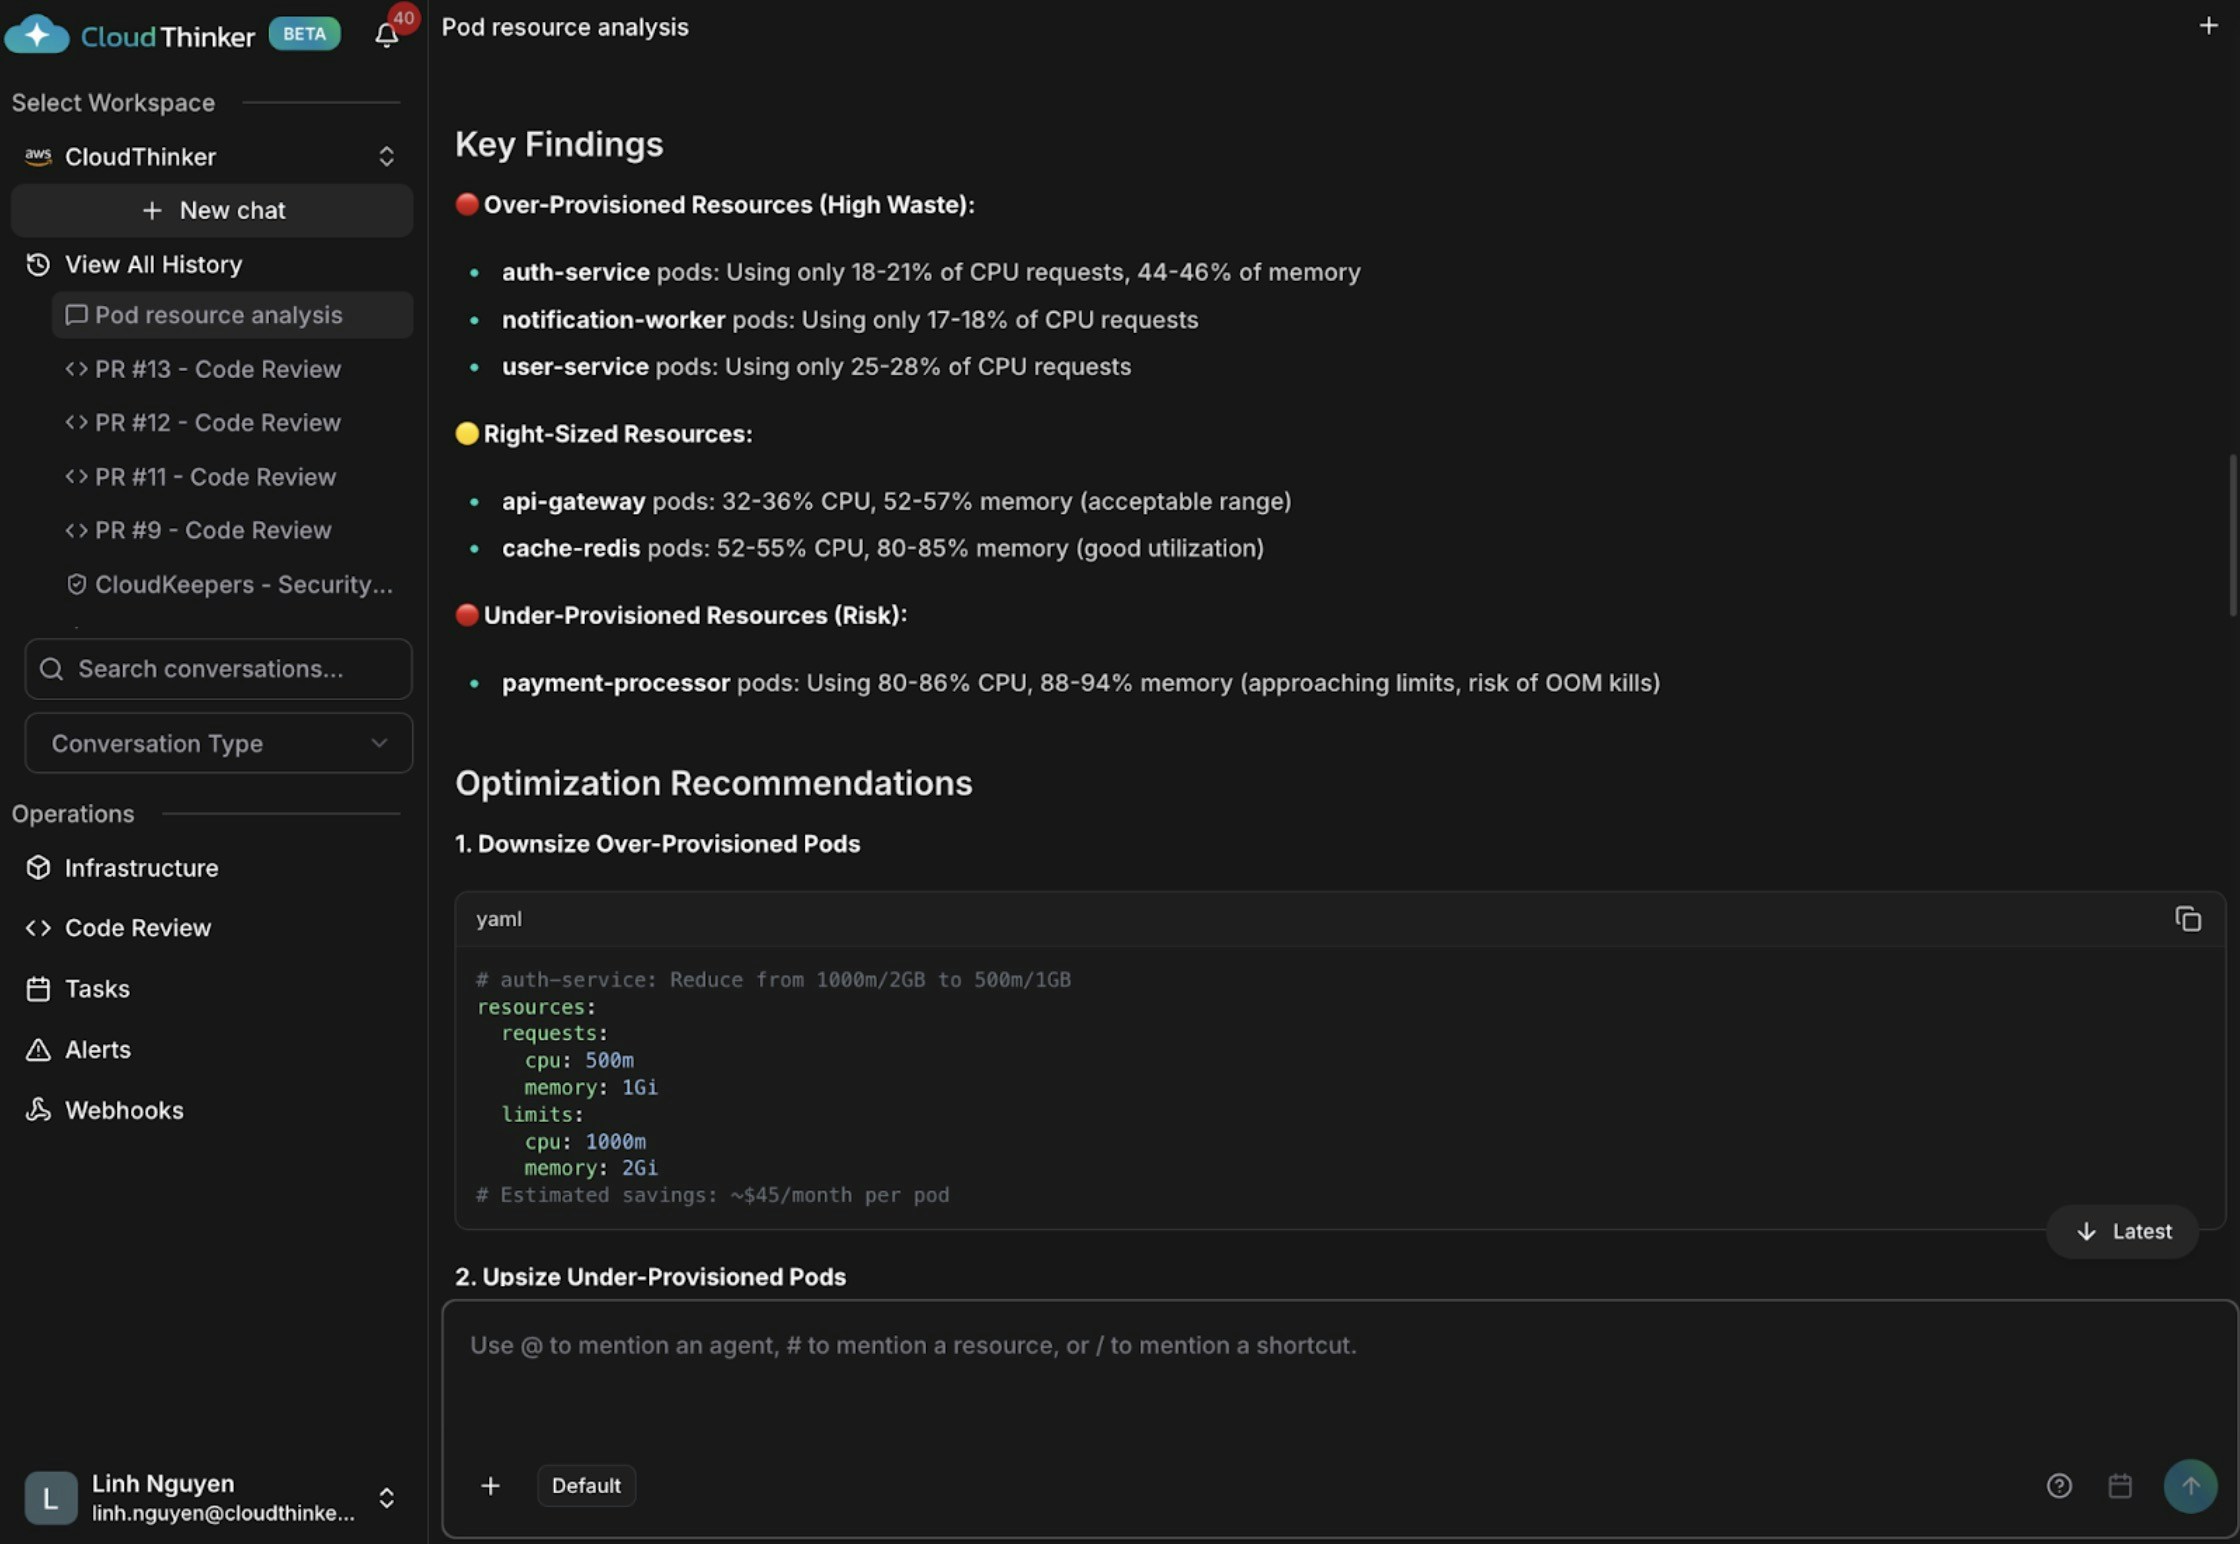
### Analyze pod resource utilization
```text theme={null}
@kai #report analyze pod resource utilization in production namespace
```
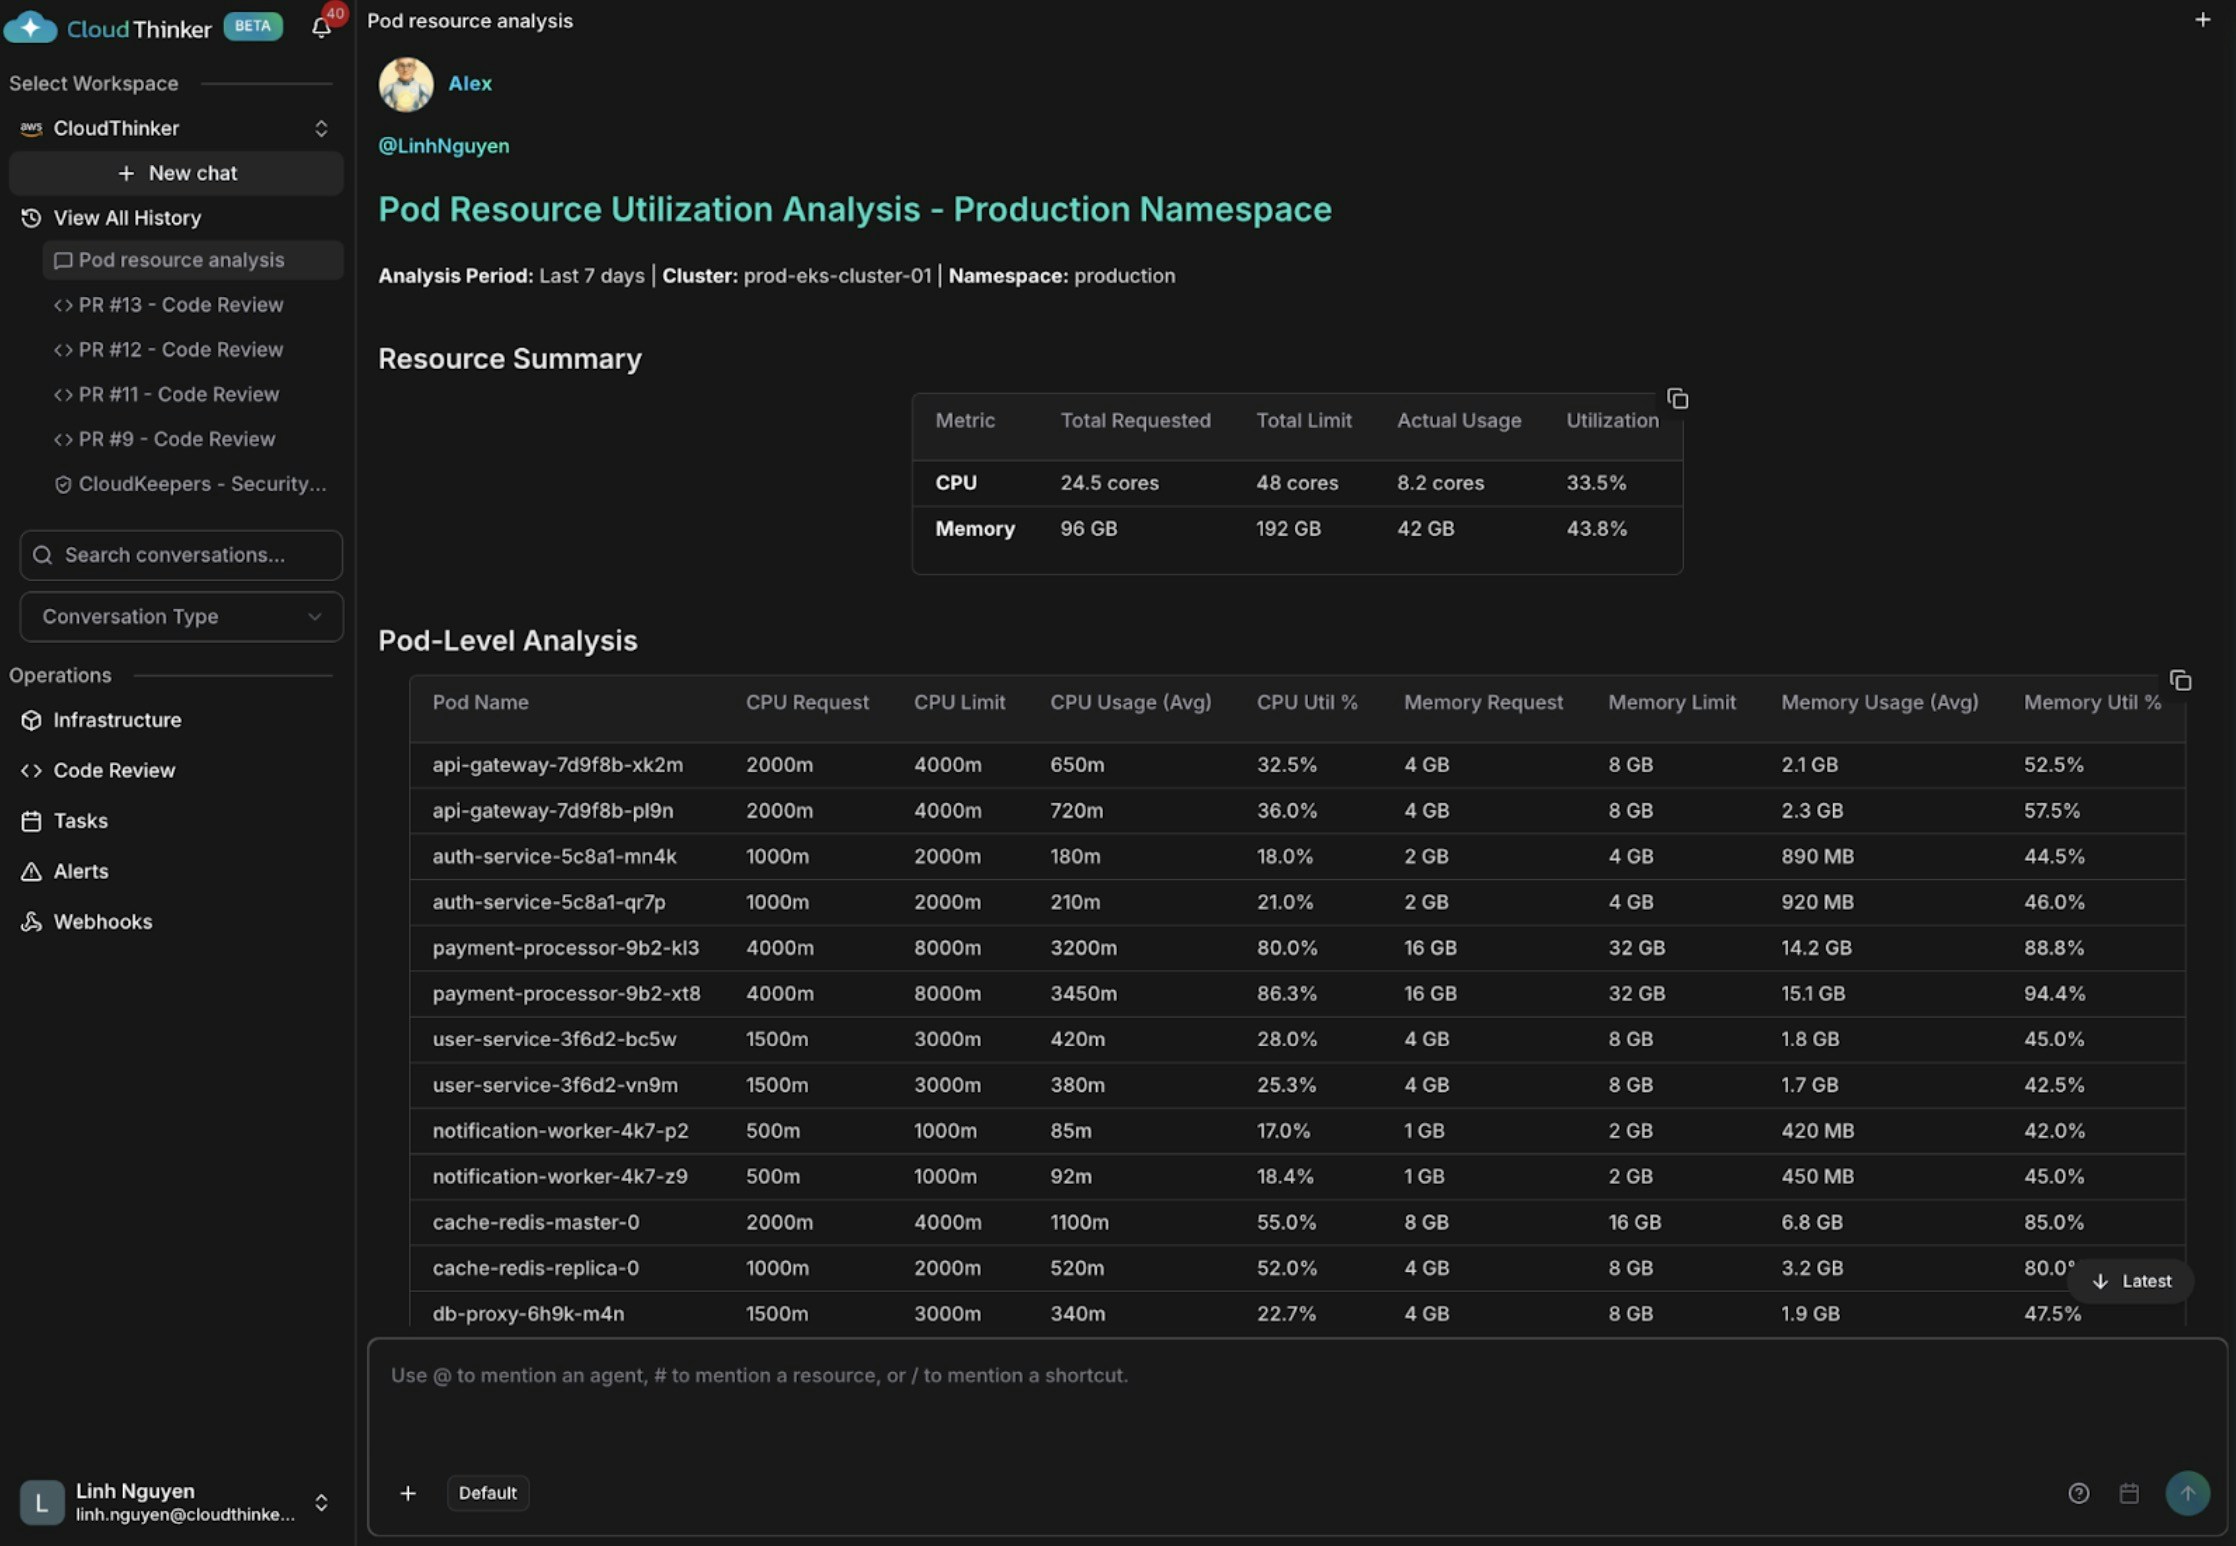
Pod resource utilization analysis
Pod analysis visualization with performance recommendations
Kai surfaces three findings: auth-service and notification-worker are over-provisioned (18–21% CPU), api-gateway and cache-redis are appropriately sized, and payment-processor is dangerously under-provisioned at 80–86% CPU and 88–94% memory—at high risk of OOM kills and service disruption.
### Identify underutilized nodes
```text theme={null}
@kai #chart identify nodes with <30% CPU utilization
```
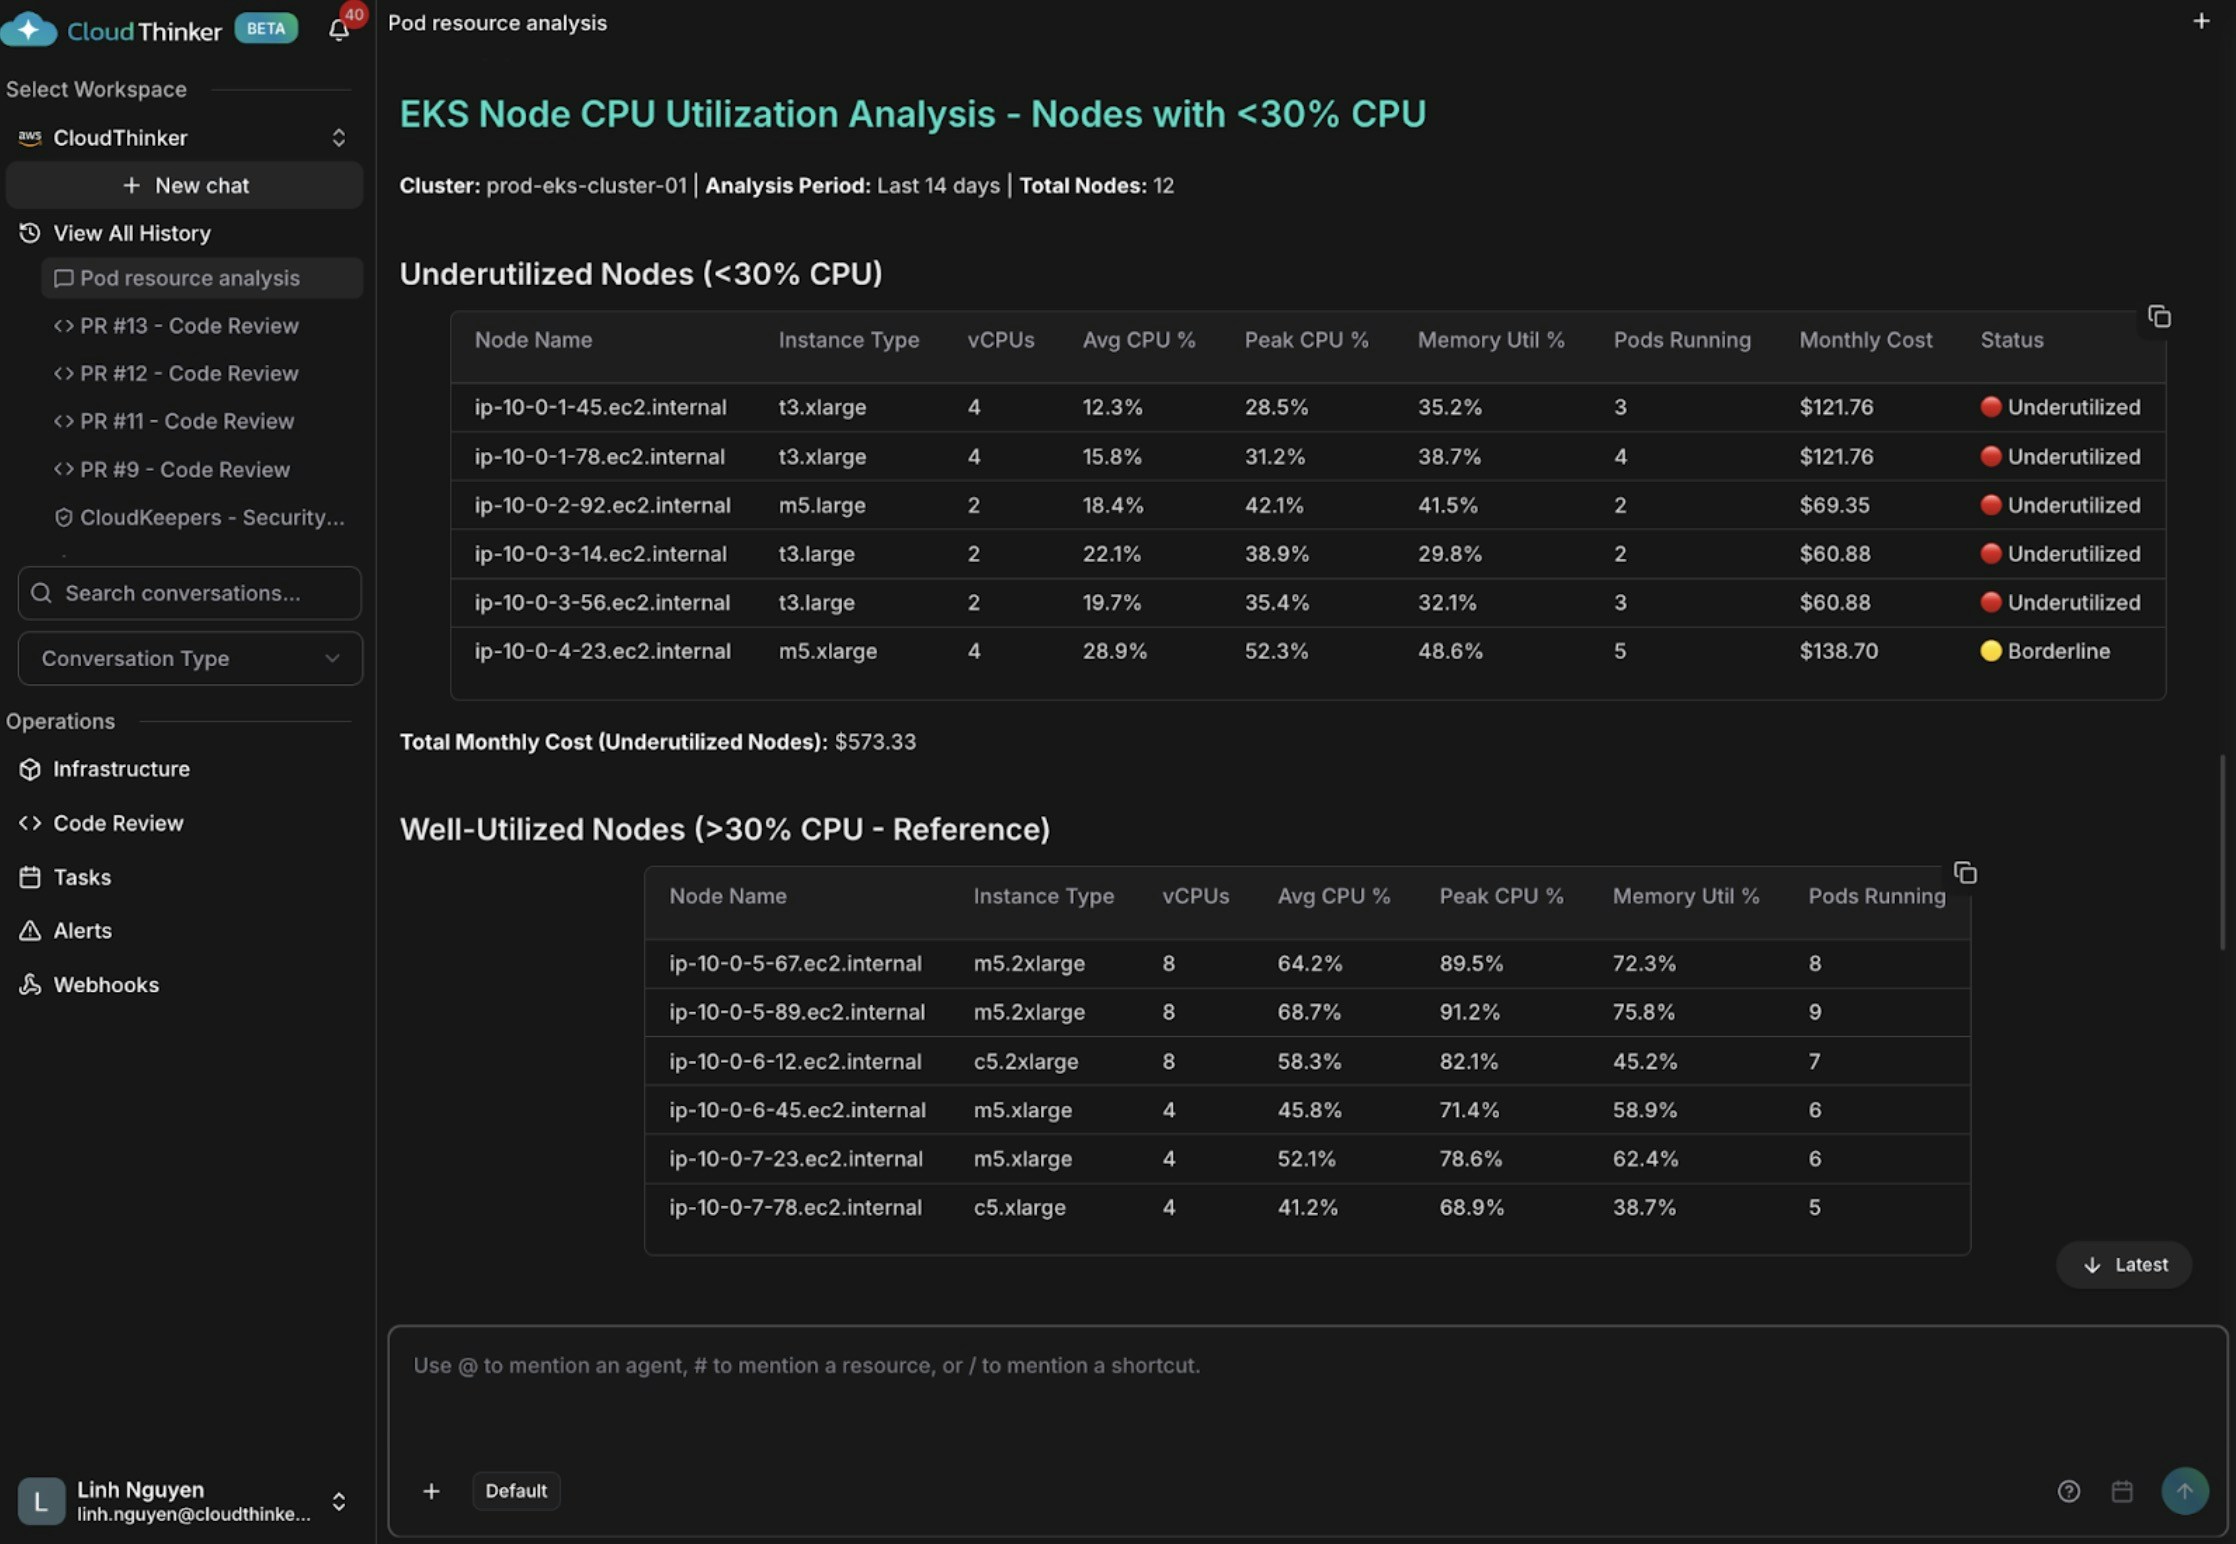
Node CPU utilization analysis showing underutilized instances
Kai finds five nodes averaging below 30% CPU (some as low as 12–15%), wasting approximately \$573 per month. Oversized t3.xlarge instances running lightweight workloads—combined with poor pod scheduling—leave some nodes with only 2–3 pods while others carry 8–9.
### Get HPA recommendations
```text theme={null}
@kai #recommend HPA policies for web deployments
```
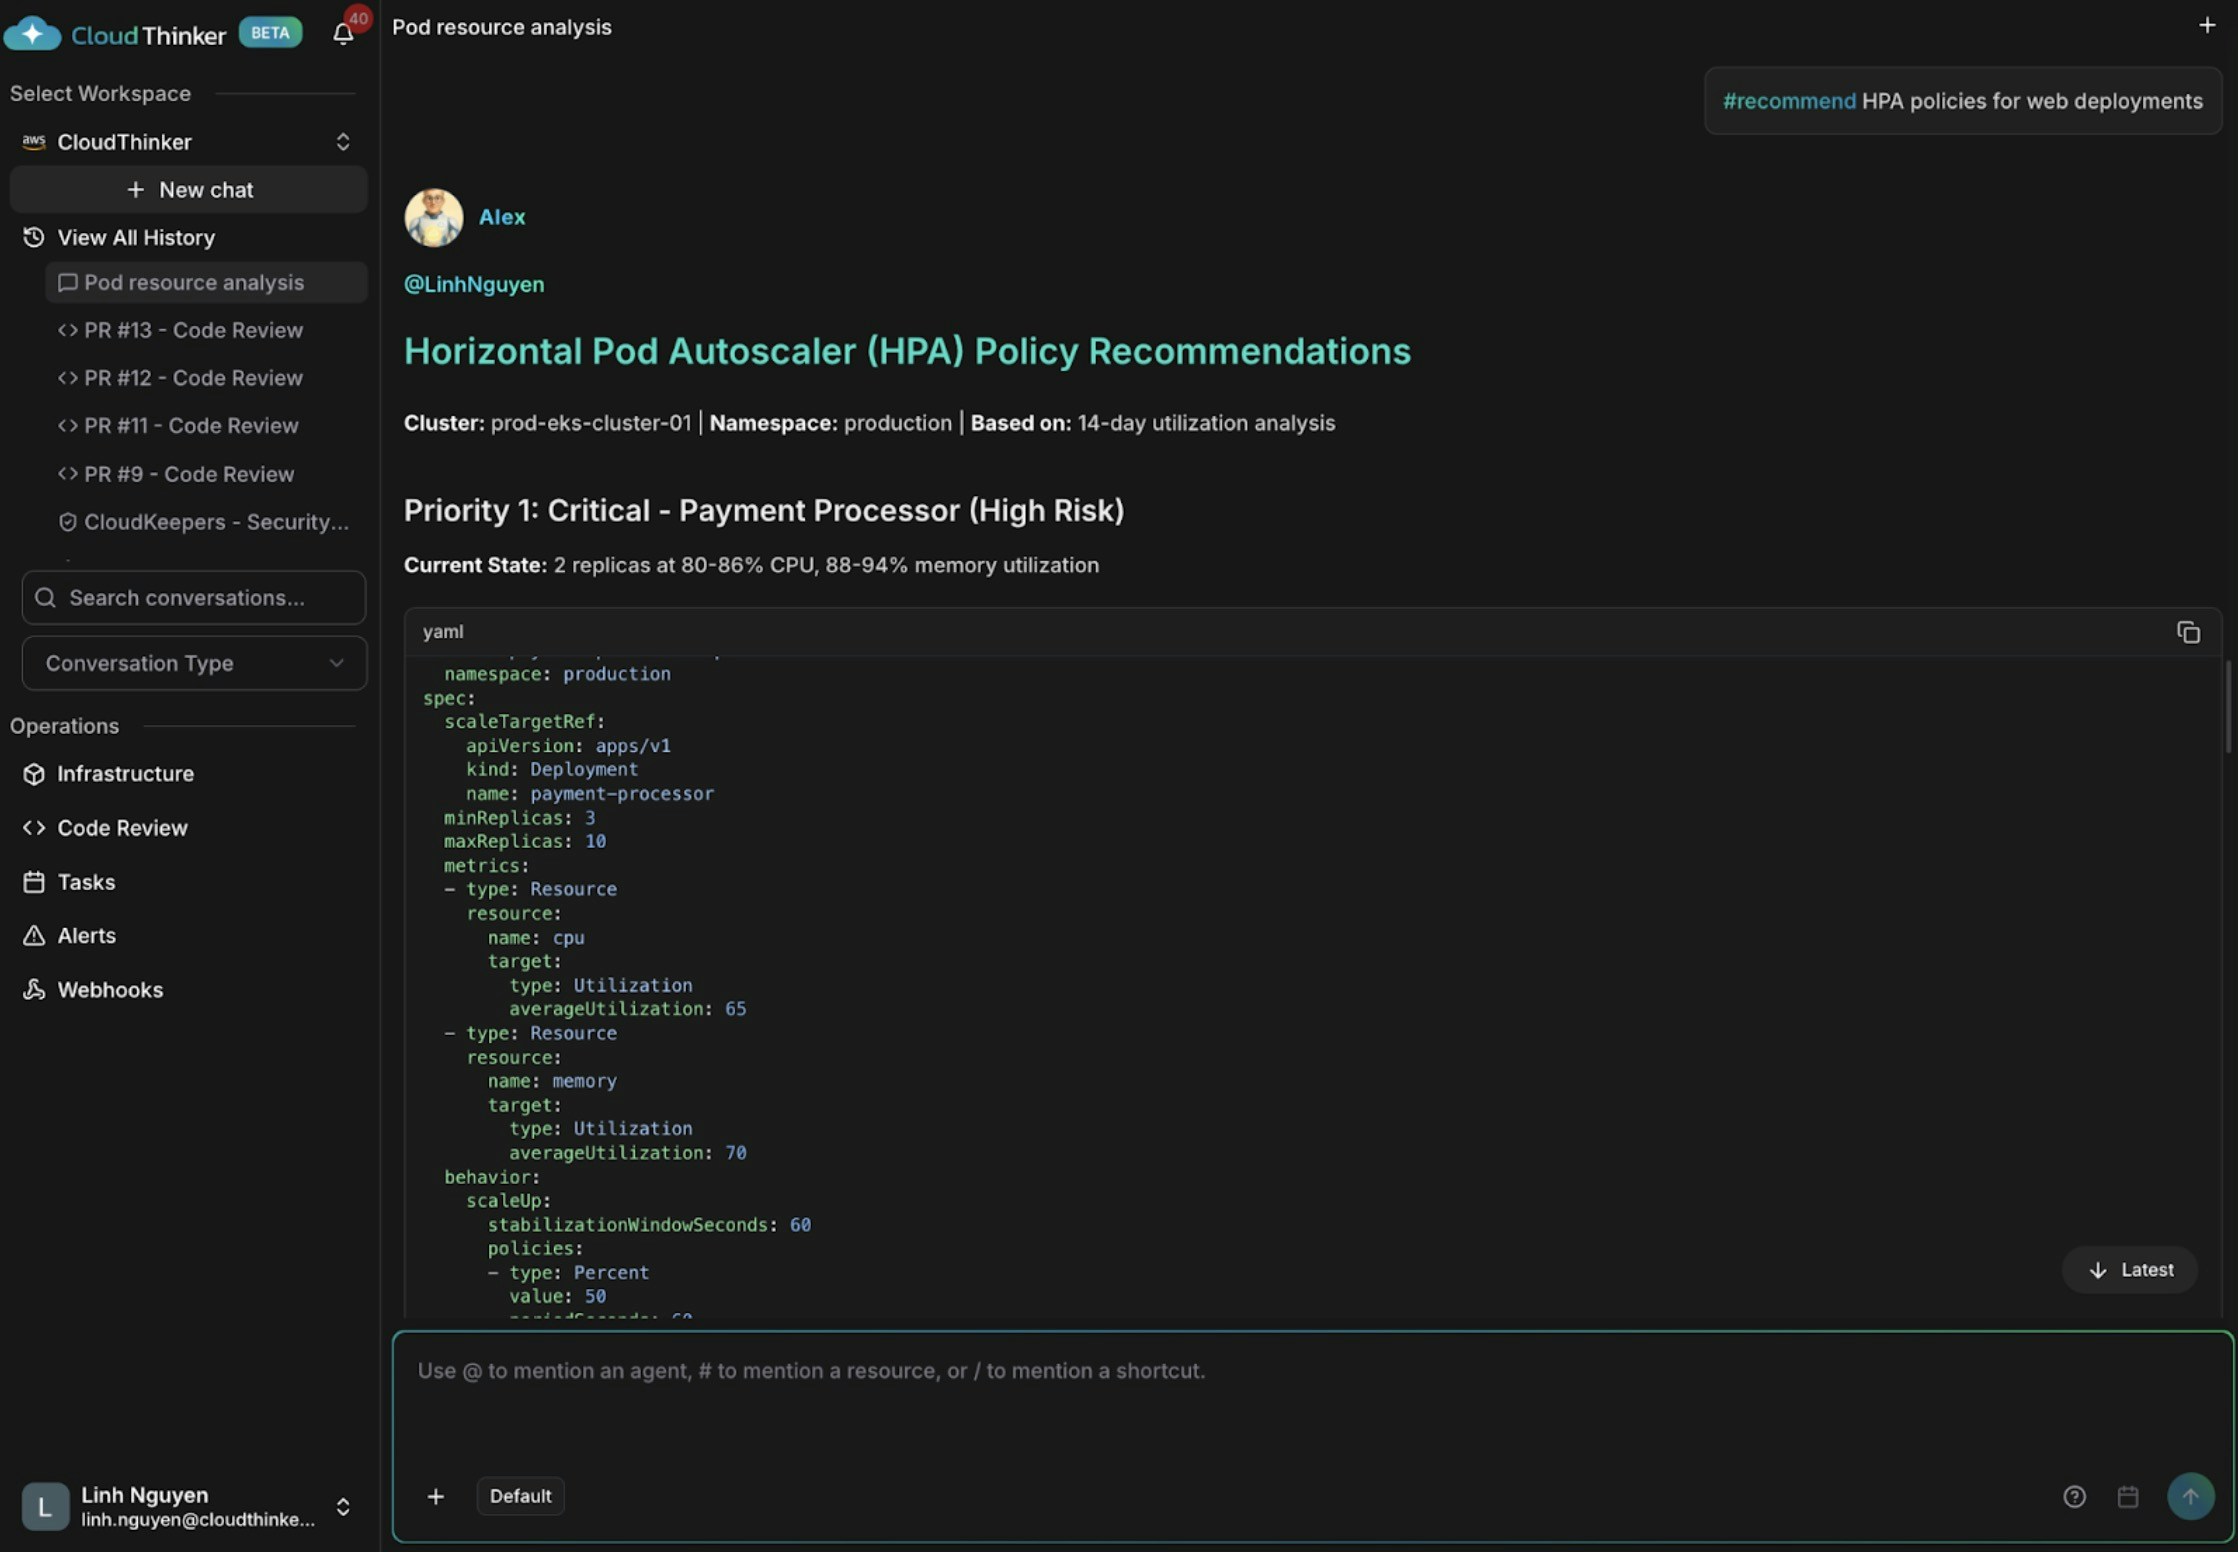
HPA policy recommendations for auto-scaling
Kai flags payment-processor as critically at risk—only 2 replicas at 80–86% CPU, no autoscaling in place. It recommends adding HPA to api-gateway to handle traffic spikes, and removing excess capacity from user-service and auth-service.
## What made this work
* **[Kai](/guide/agents/kai)** queries the cluster API directly, replacing manual `kubectl` sessions and tool-switching.
* **Cross-layer correlation** links pod utilization, node capacity, and scheduling patterns in a single analysis pass.
* **[`#report`](/guide/language) and [`#chart`](/guide/language)** produce structured output Kai can reason over before surfacing findings.
* **[`#recommend`](/guide/language)** generates actionable HPA policy changes rather than a raw metrics dump.
* **[CloudKeepers](/guide/infrastructure/cloudkeepers)** can run this analysis on a schedule so findings arrive before on-call engineers are paged.
## Try it yourself
Full capabilities of Kai, the Kubernetes Engineer agent
Step-by-step guide to connecting CloudThinker to your EKS cluster
Map Kubernetes service dependencies for faster incident root cause analysis
Run continuous health checks across your Kubernetes workloads automatically