> ## Documentation Index
> Fetch the complete documentation index at: https://docs.cloudthinker.io/llms.txt
> Use this file to discover all available pages before exploring further.
# Capabilities
> エージェントが受け付けるすべてのツールタグと、それぞれが生成する出力を確認できます — ダッシュボード、レポート、推奨事項、アラート。
ツールタグはエージェントに対して生成する出力の種類 — ダッシュボード、レポート、アラートなど — を指定します。エージェントのメンションの直後にタグを追加し、指示を書きます。
## 構文
```text theme={null}
@agent #tool instruction
```
| 部分 | 役割 |
| ------------- | ----------------------------------------------------------------------- |
| `@agent` | 特定のエージェントにリクエストをルーティングします: `@alex`、`@oliver`、`@tony`、`@kai`、または `@anna` |
| `#tool` | 出力形式を設定します。メンションの直後に配置します |
| `instruction` | スコープと制約を含む、何を求めるかを説明します |
タグの組み合わせを含む完全な構文は [CloudThinker Language](/ja/guide/language) をご覧ください。
## ツールタグ
| タグ | 出力 |
| ------------ | --------------------------------------------------------------- |
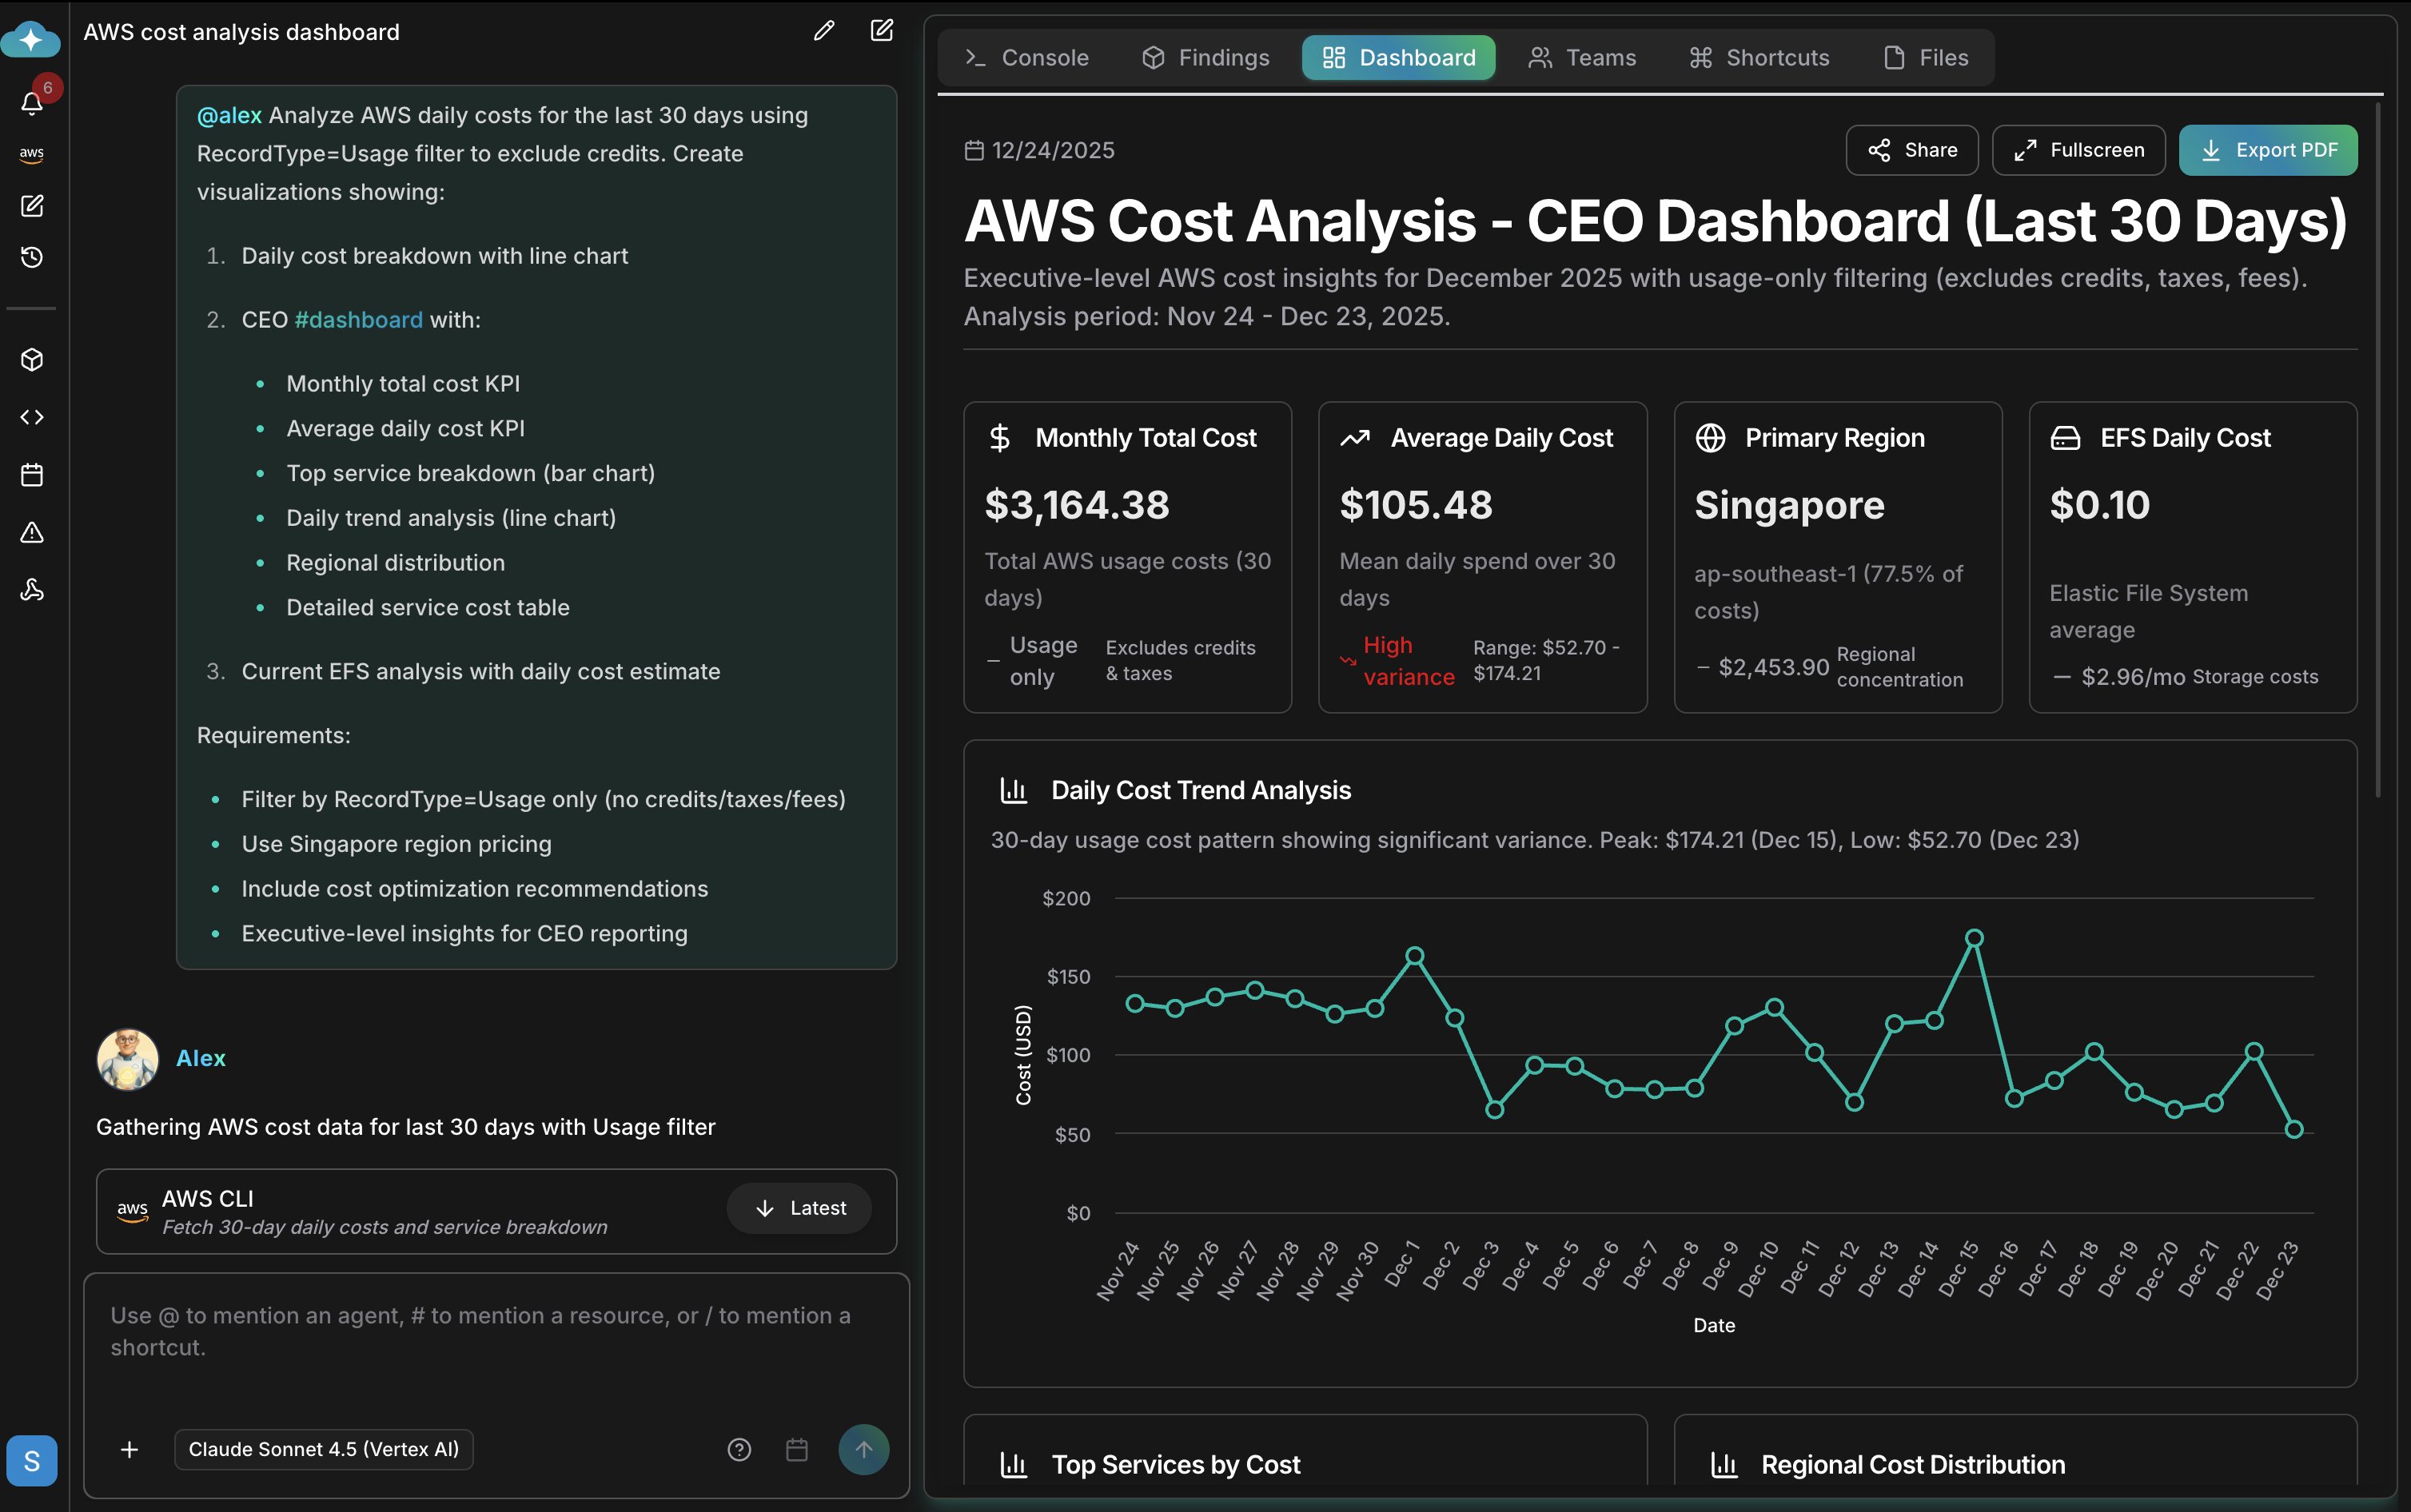
| `#dashboard` | リアルタイムメトリクス、フィルタリング可能なビュー、全画面モード、PDF エクスポートを備えたインタラクティブなダッシュボード |
| `#report` | エグゼクティブサマリー、詳細な発見事項、優先順位付きの推奨事項を含む分析ドキュメント |
| `#recommend` | 影響度で優先順位付けされた実行可能な推奨事項。工数見積もりと実装手順付き |
| `#alert` | 定義した条件でトリガーされるモニタリング通知 |
| `#chart` | スタンドアロンのデータビジュアライゼーション |
| `#kb` | 組織のナレッジベースからの検索結果 |
## ダッシュボード
`#dashboard` はライブメトリクスを含むインタラクティブなアーティファクトを生成します。フィルタリング、全画面表示、PDF エクスポートが可能です。ダッシュボードの保存、共有、管理については [Artifacts](/ja/guide/artifacts/overview) をご覧ください。
 ## 例
`#report` で分析ドキュメントを生成します:
```text theme={null}
@oliver #report SOC 2 compliance assessment
@anna #report quarterly infrastructure review
```
`#recommend` で優先順位付きのアクションを取得します:
```text theme={null}
@tony #recommend index optimizations for the orders table
@alex #recommend cost savings opportunities prioritized by impact
```
`#alert` と `#chart` でモニタリングとビジュアライゼーションをセットアップします:
```text theme={null}
@kai #alert when node CPU exceeds 80% for 5 minutes
@alex #chart spending by service over the last 6 months
```
詳細な指示を追加して出力を形成します:
```text theme={null}
@alex #dashboard AWS costs for the last 30 days
- Filter by production accounts only
- Show daily cost breakdown
- Include cost optimization recommendations
```
## 関連
`@agent #tool instruction` 構文の完全なリファレンスとプロンプトパターン
これらのツールタグを使う事前構築済みの操作を実行する
出力を自動実行するようスケジュールする — 日次レポート、週次監査
各エージェントが専門とする出力を確認する
## 例
`#report` で分析ドキュメントを生成します:
```text theme={null}
@oliver #report SOC 2 compliance assessment
@anna #report quarterly infrastructure review
```
`#recommend` で優先順位付きのアクションを取得します:
```text theme={null}
@tony #recommend index optimizations for the orders table
@alex #recommend cost savings opportunities prioritized by impact
```
`#alert` と `#chart` でモニタリングとビジュアライゼーションをセットアップします:
```text theme={null}
@kai #alert when node CPU exceeds 80% for 5 minutes
@alex #chart spending by service over the last 6 months
```
詳細な指示を追加して出力を形成します:
```text theme={null}
@alex #dashboard AWS costs for the last 30 days
- Filter by production accounts only
- Show daily cost breakdown
- Include cost optimization recommendations
```
## 関連
`@agent #tool instruction` 構文の完全なリファレンスとプロンプトパターン
これらのツールタグを使う事前構築済みの操作を実行する
出力を自動実行するようスケジュールする — 日次レポート、週次監査
各エージェントが専門とする出力を確認する