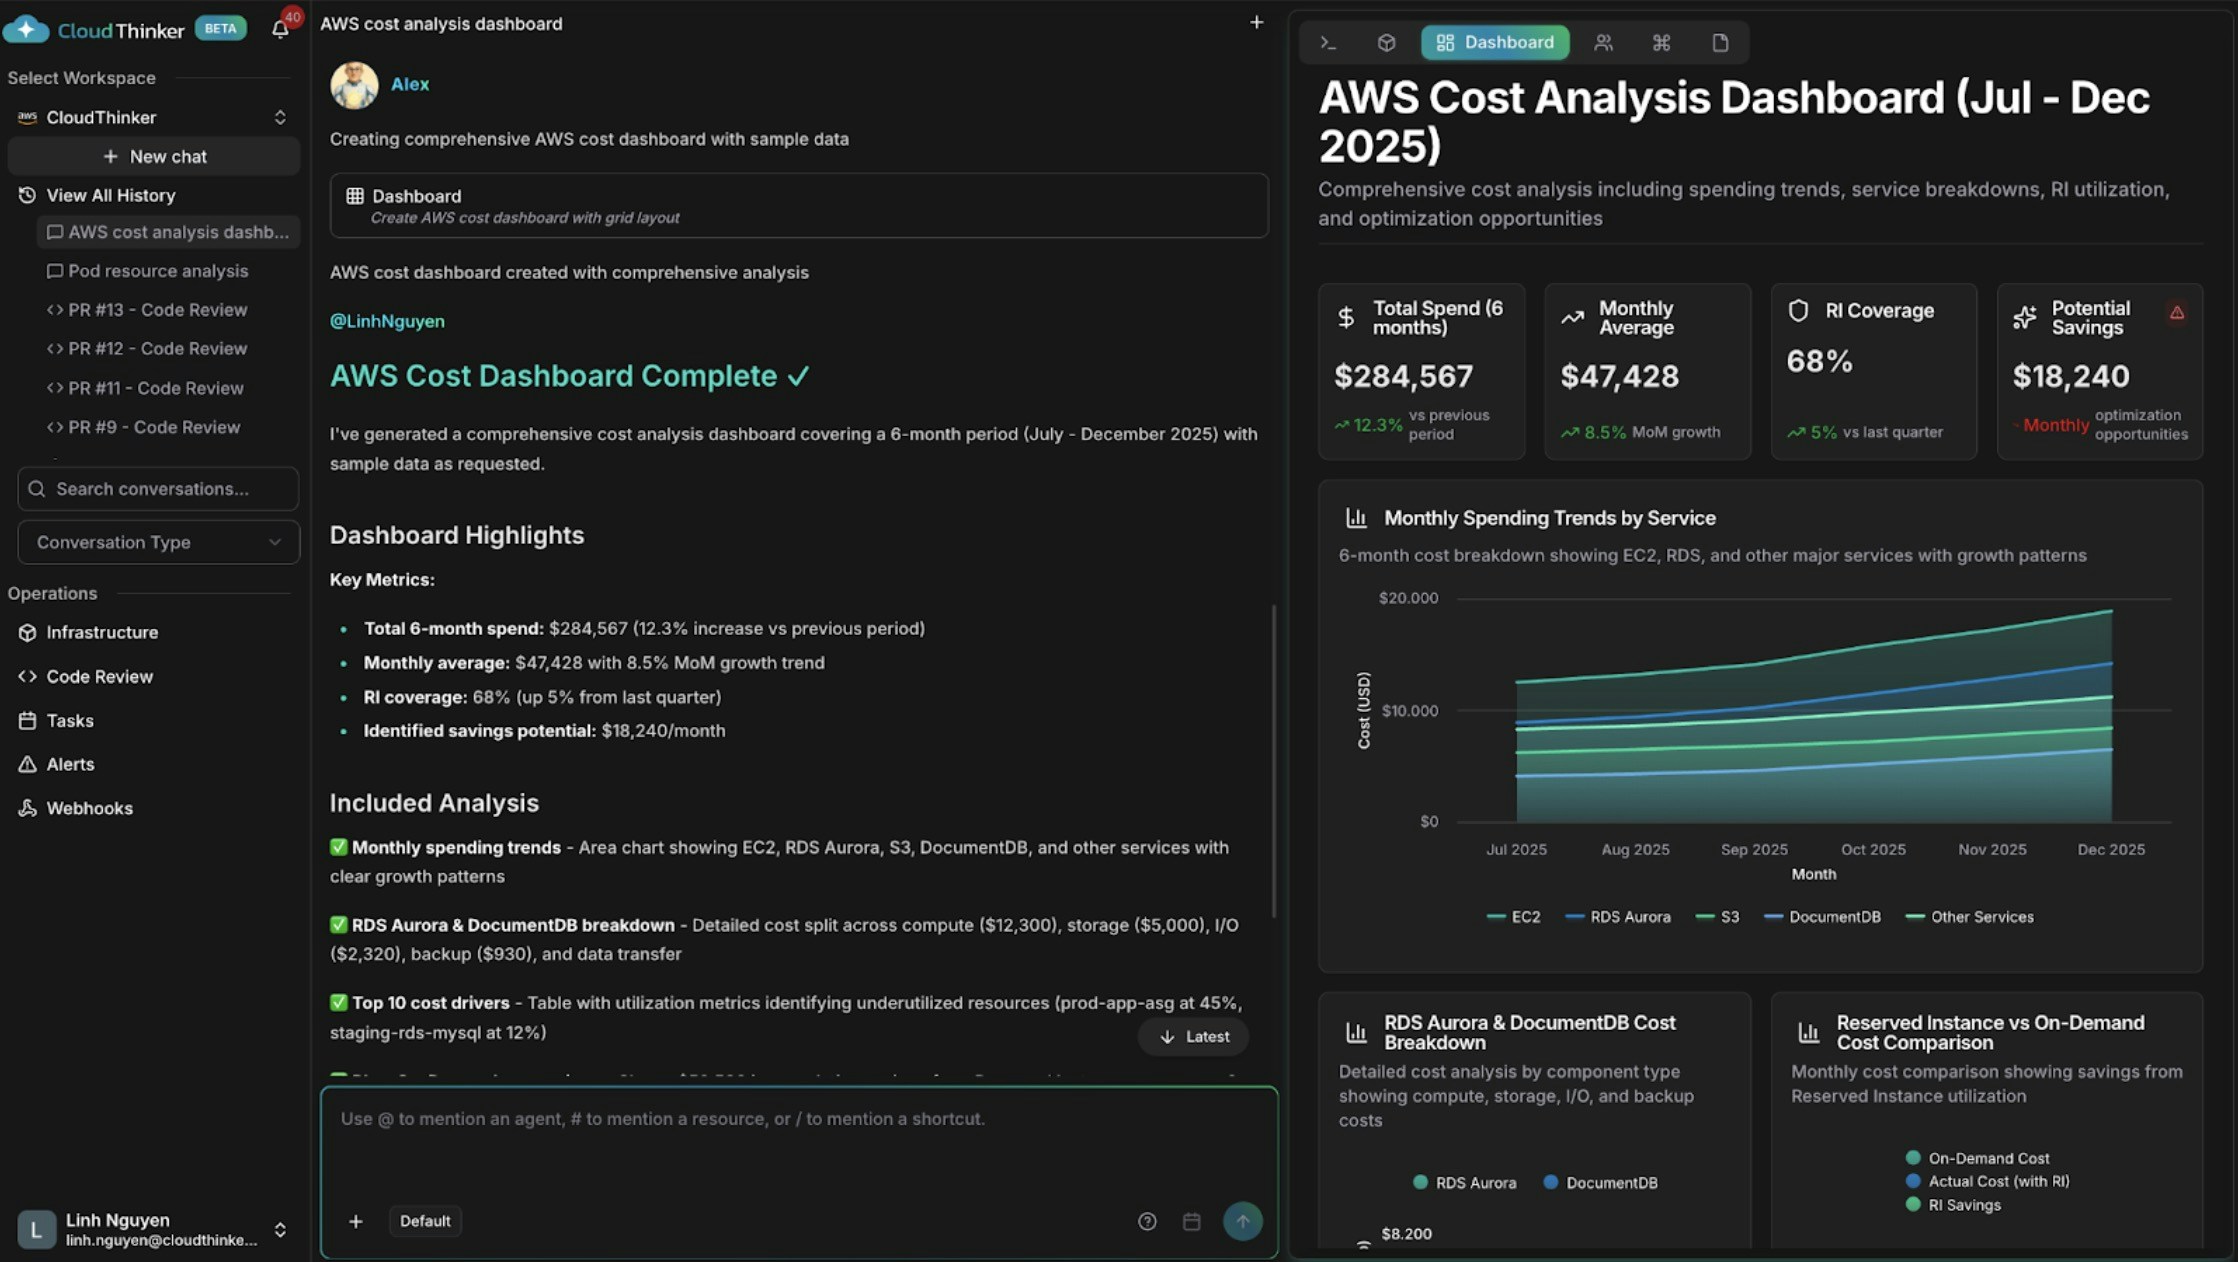
Dashboard chi phí AWS với xu hướng chi tiêu và các yếu tố chi phí
## Bạn có thể làm gì | Khả năng | Mô tả | Tìm hiểu thêm | | ------------------------------ | -------------------------------------------------------------------------------------- | -------------------------------------------------------------- | | Xây dựng dashboard chi phí | Alex vẽ biểu đồ xu hướng chi tiêu, phân tích theo service, bất thường và dự báo | [Cost analytics](/vi/guide/cost-optimization/analytics) | | Tương quan tín hiệu hạ tầng | Anna kết hợp dữ liệu sức khỏe, hiệu năng và chi phí từ nhiều cloud trong một giao diện | [Infrastructure analytics](/vi/guide/infrastructure/analytics) | | Báo cáo tình trạng bảo mật | Oliver tóm tắt trạng thái tuân thủ, phát hiện đang mở và tiến trình khắc phục | [Oliver](/vi/guide/agents/oliver) | | Trực quan hóa phụ thuộc | Khám phá mối quan hệ tài nguyên và phạm vi ảnh hưởng trên bản đồ trực tiếp | [Topology](/vi/guide/infrastructure/topology) | | Lên lịch báo cáo định kỳ | Tự động tạo lại và phân phối dashboard hoặc báo cáo | [Tasks](/vi/guide/automation/tasks) | | Đẩy kết quả sang hệ thống khác | Gửi sự kiện artifact đến các công cụ bên ngoài | [Webhooks](/vi/guide/webhooks/overview) | ## Khái niệm chính | Tag công cụ | Tạo ra | Phù hợp nhất cho | | ------------ | --------------------------------------------------------- | ------------------------------------------------- | | `#dashboard` | Dashboard tương tác nhiều widget | Theo dõi liên tục nhiều số liệu liên quan | | `#report` | Báo cáo tường thuật với dữ liệu, phát hiện và khuyến nghị | Cập nhật cho stakeholder, kiểm tra và đánh giá | | `#chart` | Hình ảnh trực quan tập trung duy nhất | Theo dõi một số liệu hoặc xu hướng theo thời gian | ## Ví dụ prompt Bắt đầu với yêu cầu một dòng — agent chọn các giá trị mặc định hợp lý cho phạm vi và khoảng thời gian: ```text theme={null} @alex #dashboard AWS spending by service for the last 30 days @oliver #report quarterly security assessment across all accounts @kai #dashboard cluster resource utilization ``` ### Dashboard phân tích chi phí Thêm cấu trúc vào hướng dẫn khi bạn cần phân tích cụ thể: ```text theme={null} @alex #dashboard Generate a comprehensive AWS cost dashboard for [start_date] to [end_date]. Include: - Monthly spending trends by service with month-over-month growth rates - Top 10 cost drivers and their utilization patterns - Reserved Instance vs On-Demand cost comparison - Cost anomalies and optimization opportunities with estimated savings Segment by: [cost allocation tags such as environment, team, or application] ``` ### Dashboard đa lĩnh vực Yêu cầu Anna tương quan dữ liệu nằm ở các hệ thống khác nhau: ```text theme={null} @anna #dashboard Create an operational dashboard correlating database performance with infrastructure costs for [time_period]. Analyze: - Aurora and DocumentDB query performance metrics - Resource utilization and spending patterns - Correlation between database load and compute and storage costs Context: [recent changes, migrations, or specific concerns] ```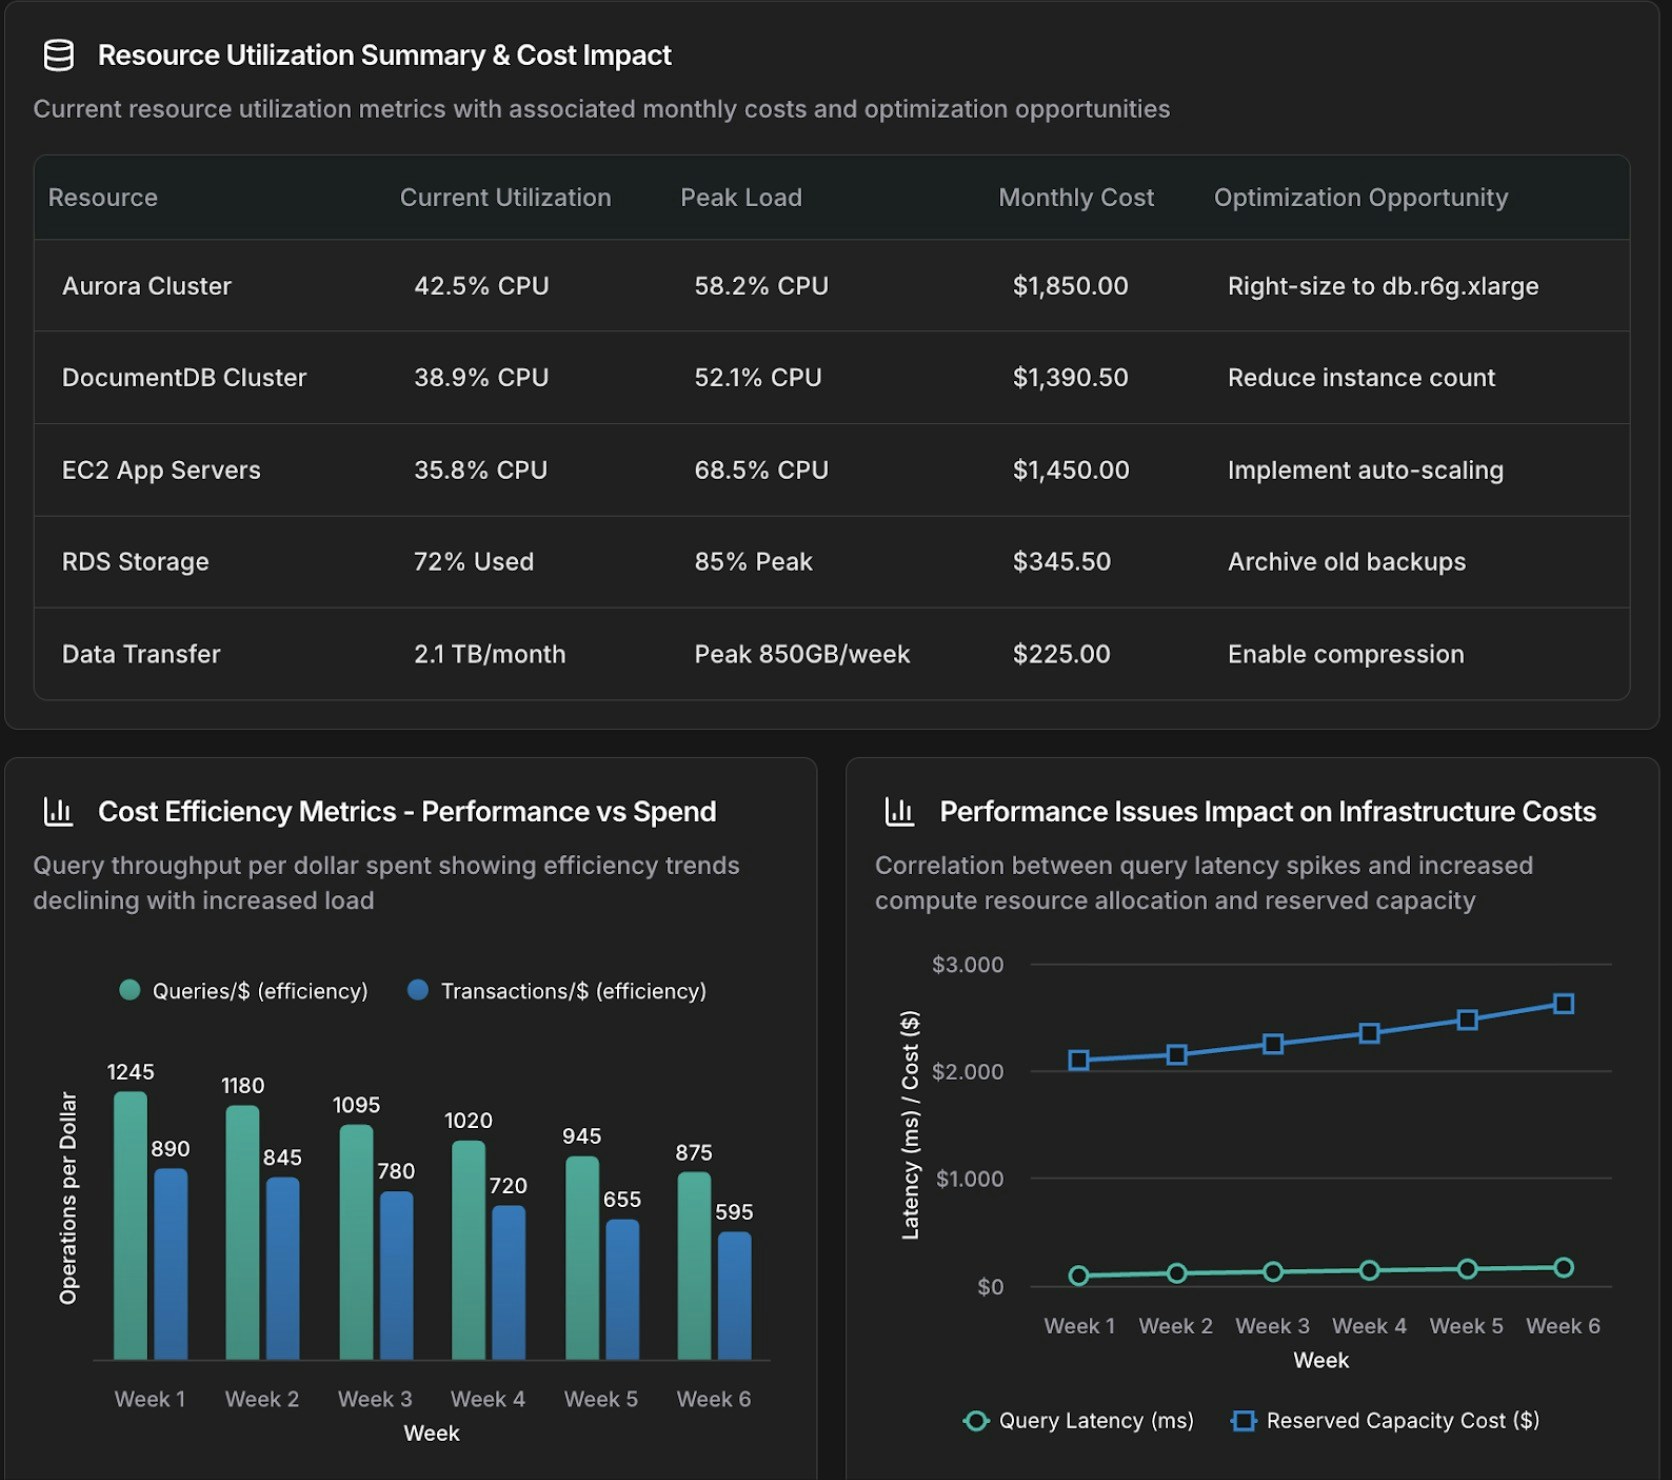
Dashboard tương quan cơ sở dữ liệu và hạ tầng
### Biểu đồ tập trung Dùng `#chart` cho một hình ảnh trực quan duy nhất thay vì toàn bộ dashboard: ```text theme={null} @tony #chart Show query execution time trends for Aurora cluster [cluster-identifier] over the past [time_period]. - Metrics: p50, p95, p99 query latency - Separate lines for read queries vs write queries - Highlight queries exceeding [threshold] ms ```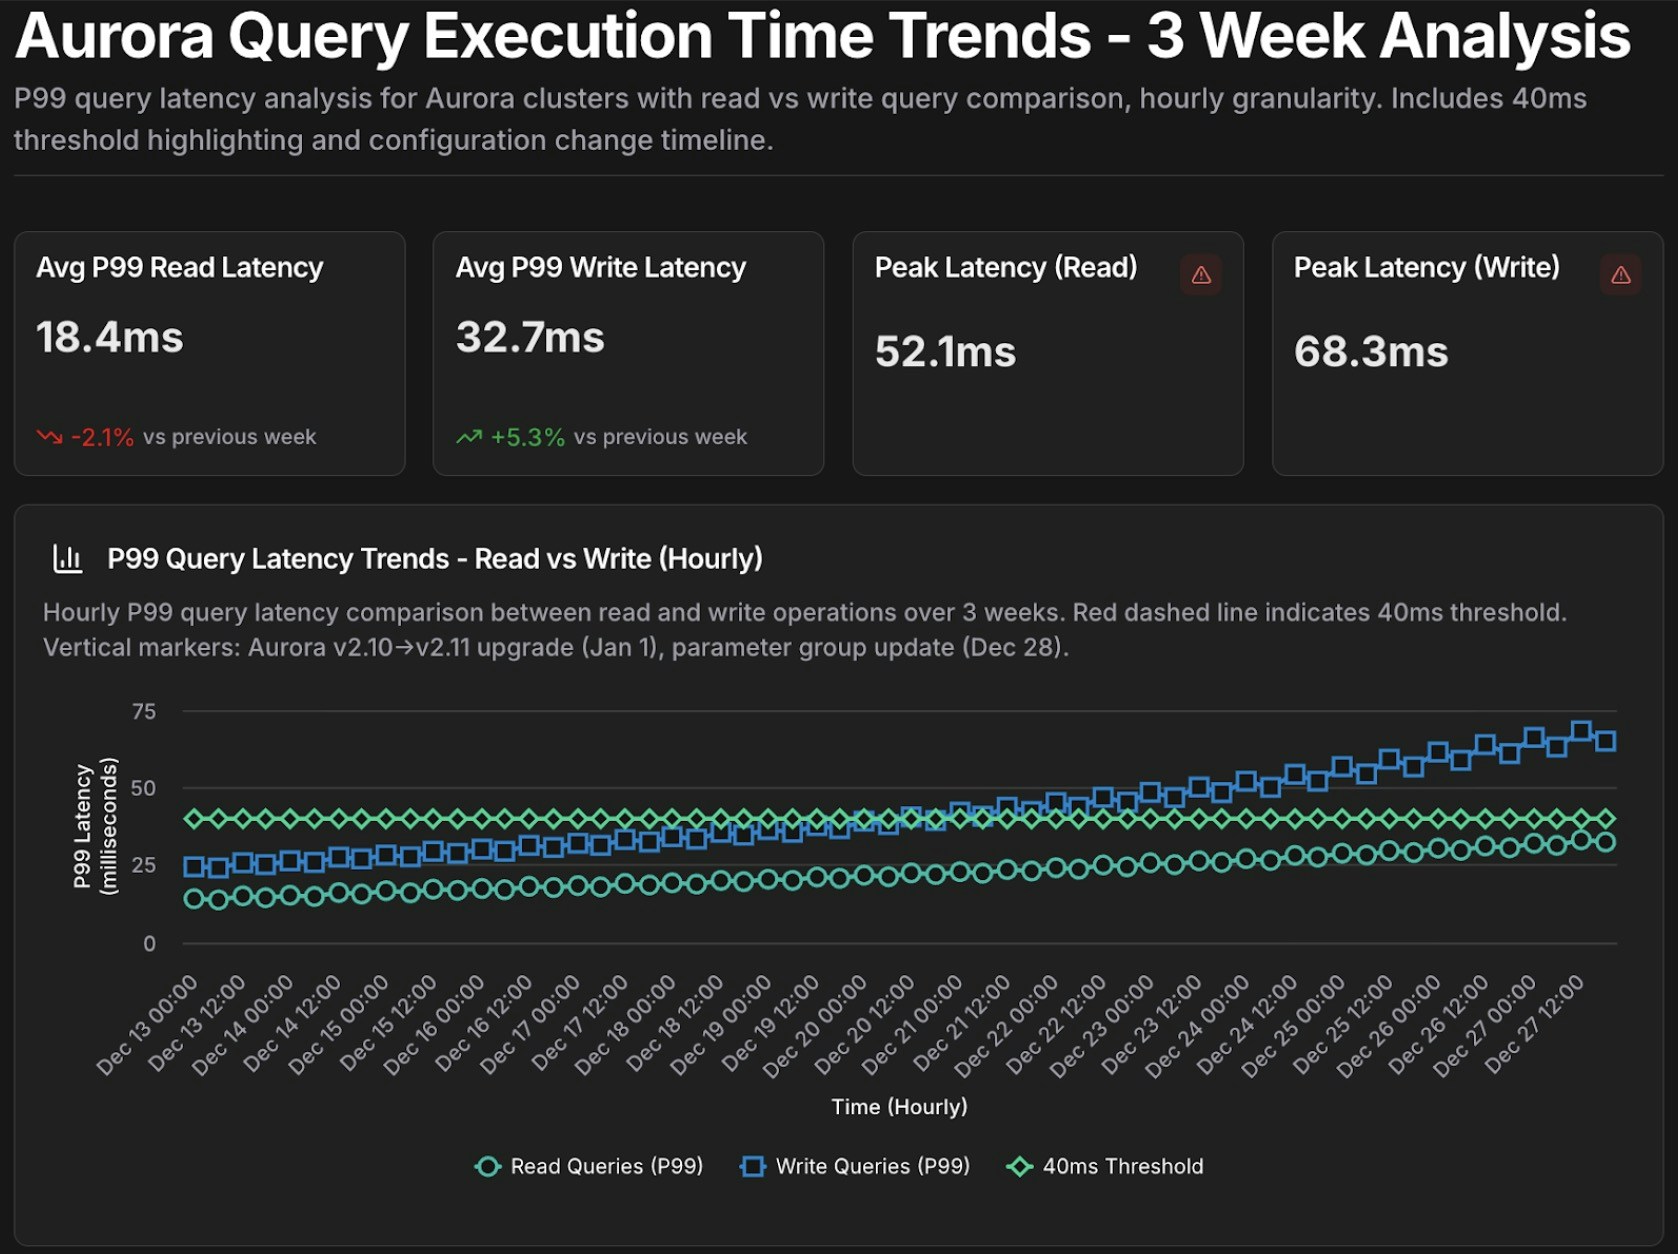
Biểu đồ chuỗi thời gian hiệu năng truy vấn Aurora
## Template có thể tái sử dụng Lưu các prompt được tham số hóa dưới dạng template cho các cuộc điều tra định kỳ, sau đó điền vào `{biến}` trong mỗi lần chạy: ```text theme={null} Template: database_performance_review @tony #dashboard Create a performance dashboard for Aurora cluster {cluster_id} covering {time_period}. Include: - Slow query analysis (queries exceeding {latency_threshold} ms) - Resource utilization trends (CPU, memory, IOPS) - Replica lag monitoring - Connection pool health Compare against baseline: {comparison_period} Alert on: queries exceeding p95 latency of {latency_threshold} ms Template: cost_anomaly_investigation @alex #report Investigate the cost anomaly for {service_name} on {date}. - Compare costs to the 7-day and 30-day averages - Break down by cost component (compute, storage, I/O, data transfer) - Identify the specific resources driving the increase and quantify the impact - Recommend immediate actions to mitigate ongoing cost increases ``` Ví dụ, chạy `database_performance_review` với `cluster_id=production-aurora-cluster`, `time_period="past 7 days"`, `comparison_period="previous 30 days"` và `latency_threshold=200`.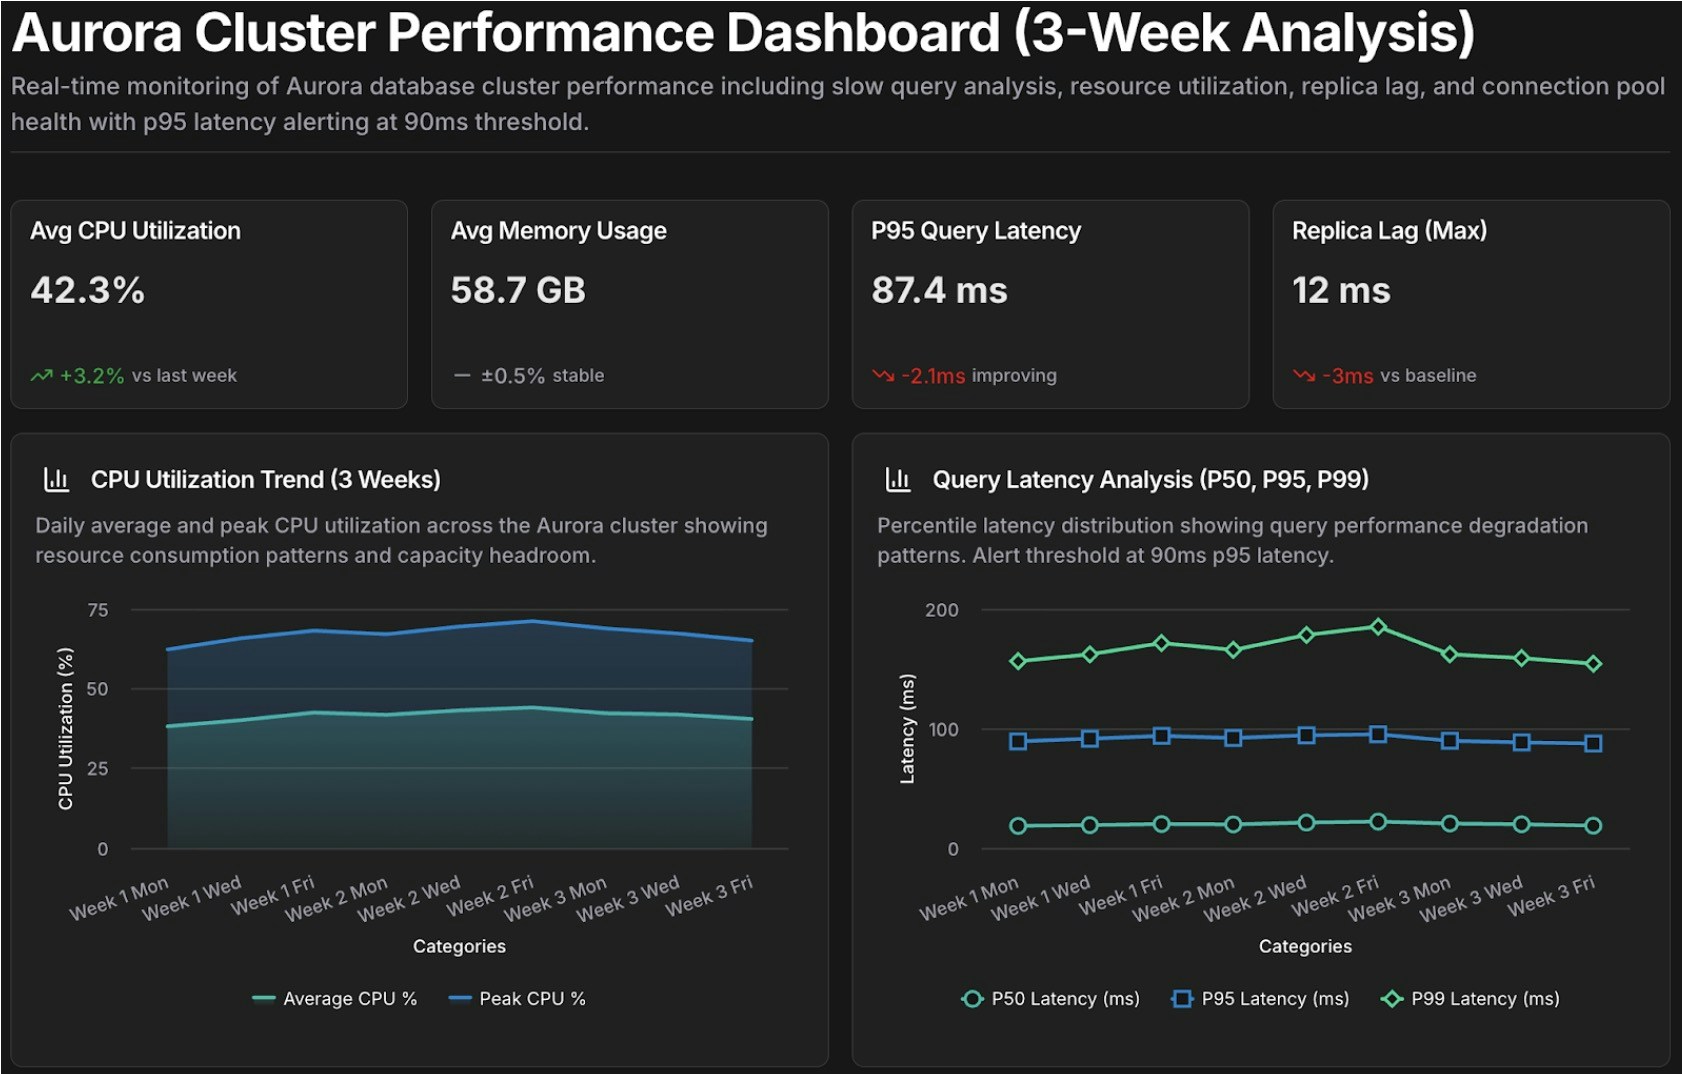
Template dashboard đánh giá hiệu năng
## Bước tiếp theo