Start here
Three first tasks, each 5–10 minutes with a result you can verify. New workspace? Connect AWS first — the quickstart walks you through it.Run your first cost analysis
Find idle resources, oversized instances, and unused commitments — with projected monthly savings
Set up code review
Connect a Git repository and get AI review comments on the next pull request
Investigate an incident
Wire Pulse to your monitoring and let agents form hypotheses, gather evidence, and propose remediation
Choose your goal
Pick the outcome you want next. Each goal maps to a guided path.Spend less
CostOps — continuous spend audit across AWS, Azure, and GCP with rightsizing recommendations and approval-gated remediation
Ship safer
Code Review — every PR reviewed with context from running infrastructure, past incidents, and your team’s conventions
Resolve incidents faster
Deep Response Engine — Pulse strips noise from monitoring; agents investigate the rest and run approved runbooks
Assess your cloud posture
Assessment — Well-Architected analysis across resources and pillars, on demand
Automate recurring ops
Autonomous agents + skills — encode your runbooks, conventions, and policies so the loop runs without restating them
Learn the platform end to end
Tutorial — run your role’s first prompts against your live environment, then follow the chain into your first module setup
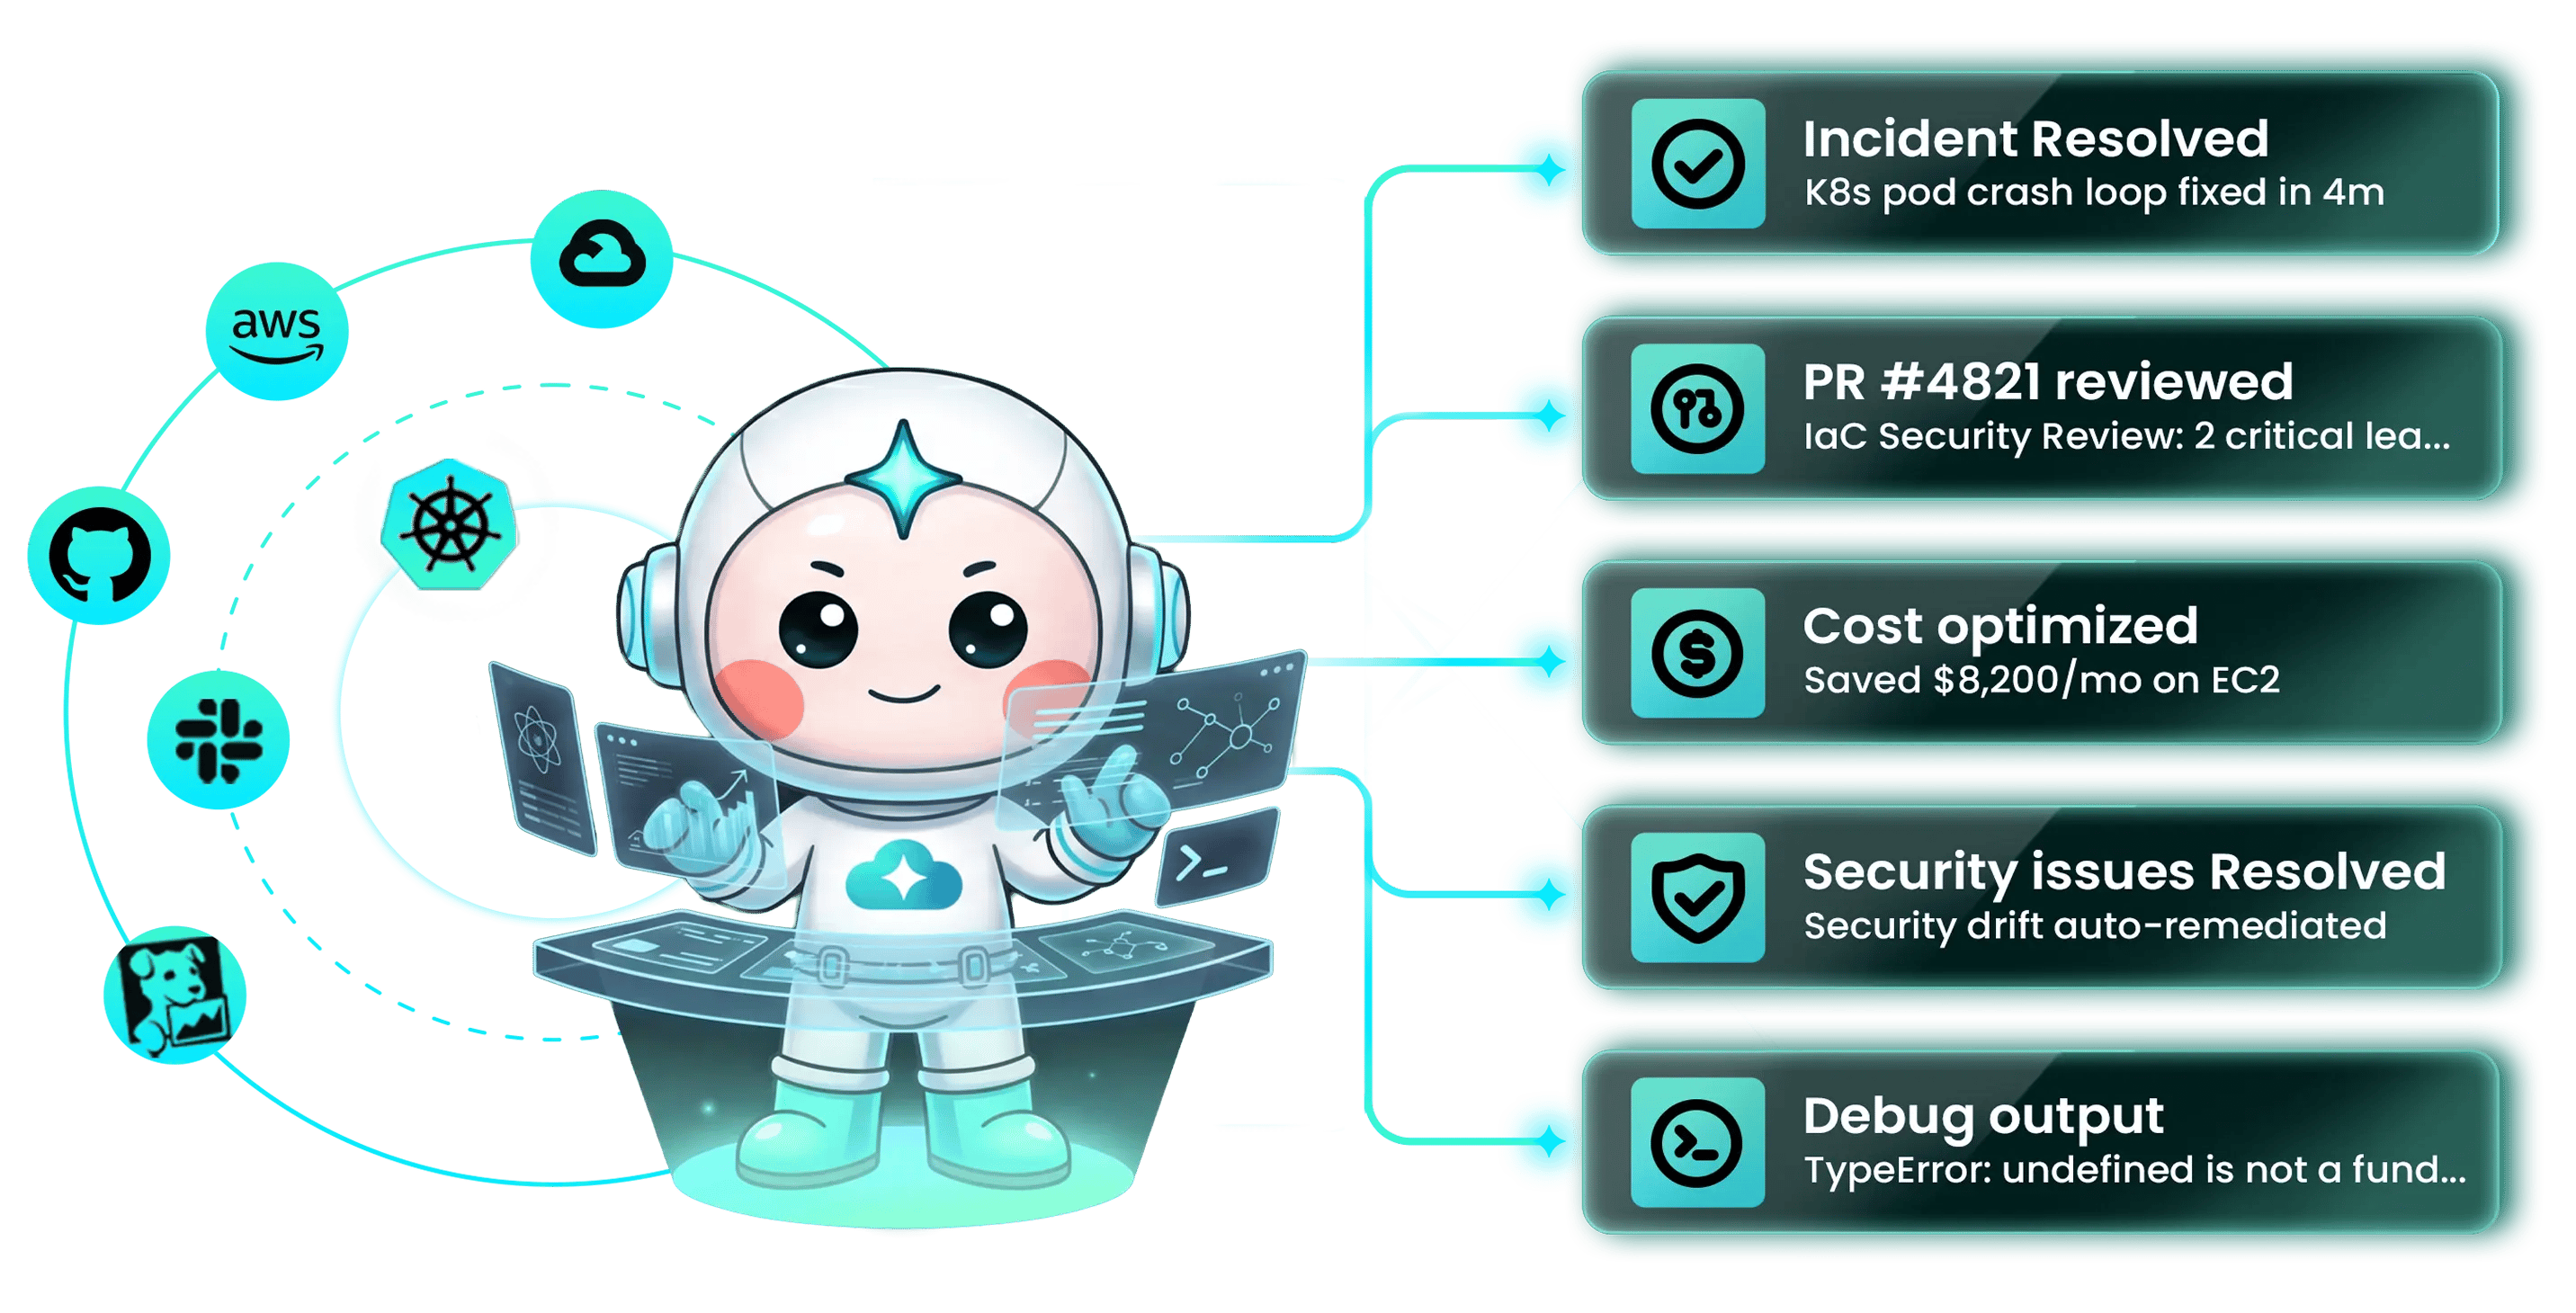
How CloudThinker works
Every module runs the same agentic loop: Detect → Analyze → Resolve → Validate.
You stay on the loop, not in every step: set the goal, choose the autonomy mode, and intervene when judgment matters. The AgenticOps field guide covers the reference architecture and governance discipline behind the loop.
The six modules
Code Review
AI review on every PR with context from running infrastructure, past incidents, and team conventions. Inline comments, reproduction steps, suggested patches.
SecOps
Research PreviewContinuous configuration assessment and vulnerability scans across cloud, container, and IaC layers. Findings ranked by exploitability; fixes opened as pull requests.
ChatOps
Agents operate inside Slack, Microsoft Teams, and the CLI. Query infrastructure, approve actions, and review changes without leaving your workflow.
Skills
Reusable packages of runbooks, conventions, and policies that agents load automatically — your team’s expertise compounds instead of leaving with the engineer who wrote it.