The Problem
Modern cloud applications are webs of dependencies — load balancers, auto-scaling groups, databases, caches, queues, Lambda functions, Kubernetes services — all connected. When something breaks, the critical question is: what depends on what? Without a topology map, incident investigation looks like this: an alert fires, engineers start checking every service manually, nobody knows the blast radius, and MTTR stretches to hours while teams debate which service is the actual origin. Architecture diagrams in Confluence are outdated within days of being created. Nobody has time to maintain them. And when an audit asks for data flow documentation or an engineer asks “what breaks if this RDS instance goes down?”, the honest answer is: nobody knows for certain.How Existing Tools Compare
| Tool | What It Does | What’s Missing |
|---|---|---|
| AWS X-Ray Service Map | Live request tracing between services | Requires X-Ray instrumentation in every service; AWS-only; shows request flows, not infrastructure dependencies |
| Datadog Service Map | Application dependency visualization | Requires full Datadog agent deployment; application-layer only, not infrastructure layer |
| Dynatrace SmartScape | Automatic dependency discovery | Proprietary, expensive, requires Dynatrace agents everywhere |
| Cloudcraft | Cloud architecture diagramming | Manual drawing tool — not connected to live infrastructure; goes stale immediately |
| Lucidchart / Draw.io | General diagramming | Static diagrams with no live infrastructure connection |
What Makes This Different
- Live discovery: agents discover topology from AWS/GCP/Azure APIs, Terraform state, or CloudFormation — no instrumentation required
- RCA-integrated: when an incident occurs, agents use topology to trace the impact path and identify the origin service automatically
- Multi-cloud: a single topology view spanning AWS, Azure, GCP, and Kubernetes — not separate maps per provider
- Dynamic: continuously synced as infrastructure changes, not a static diagram that goes stale
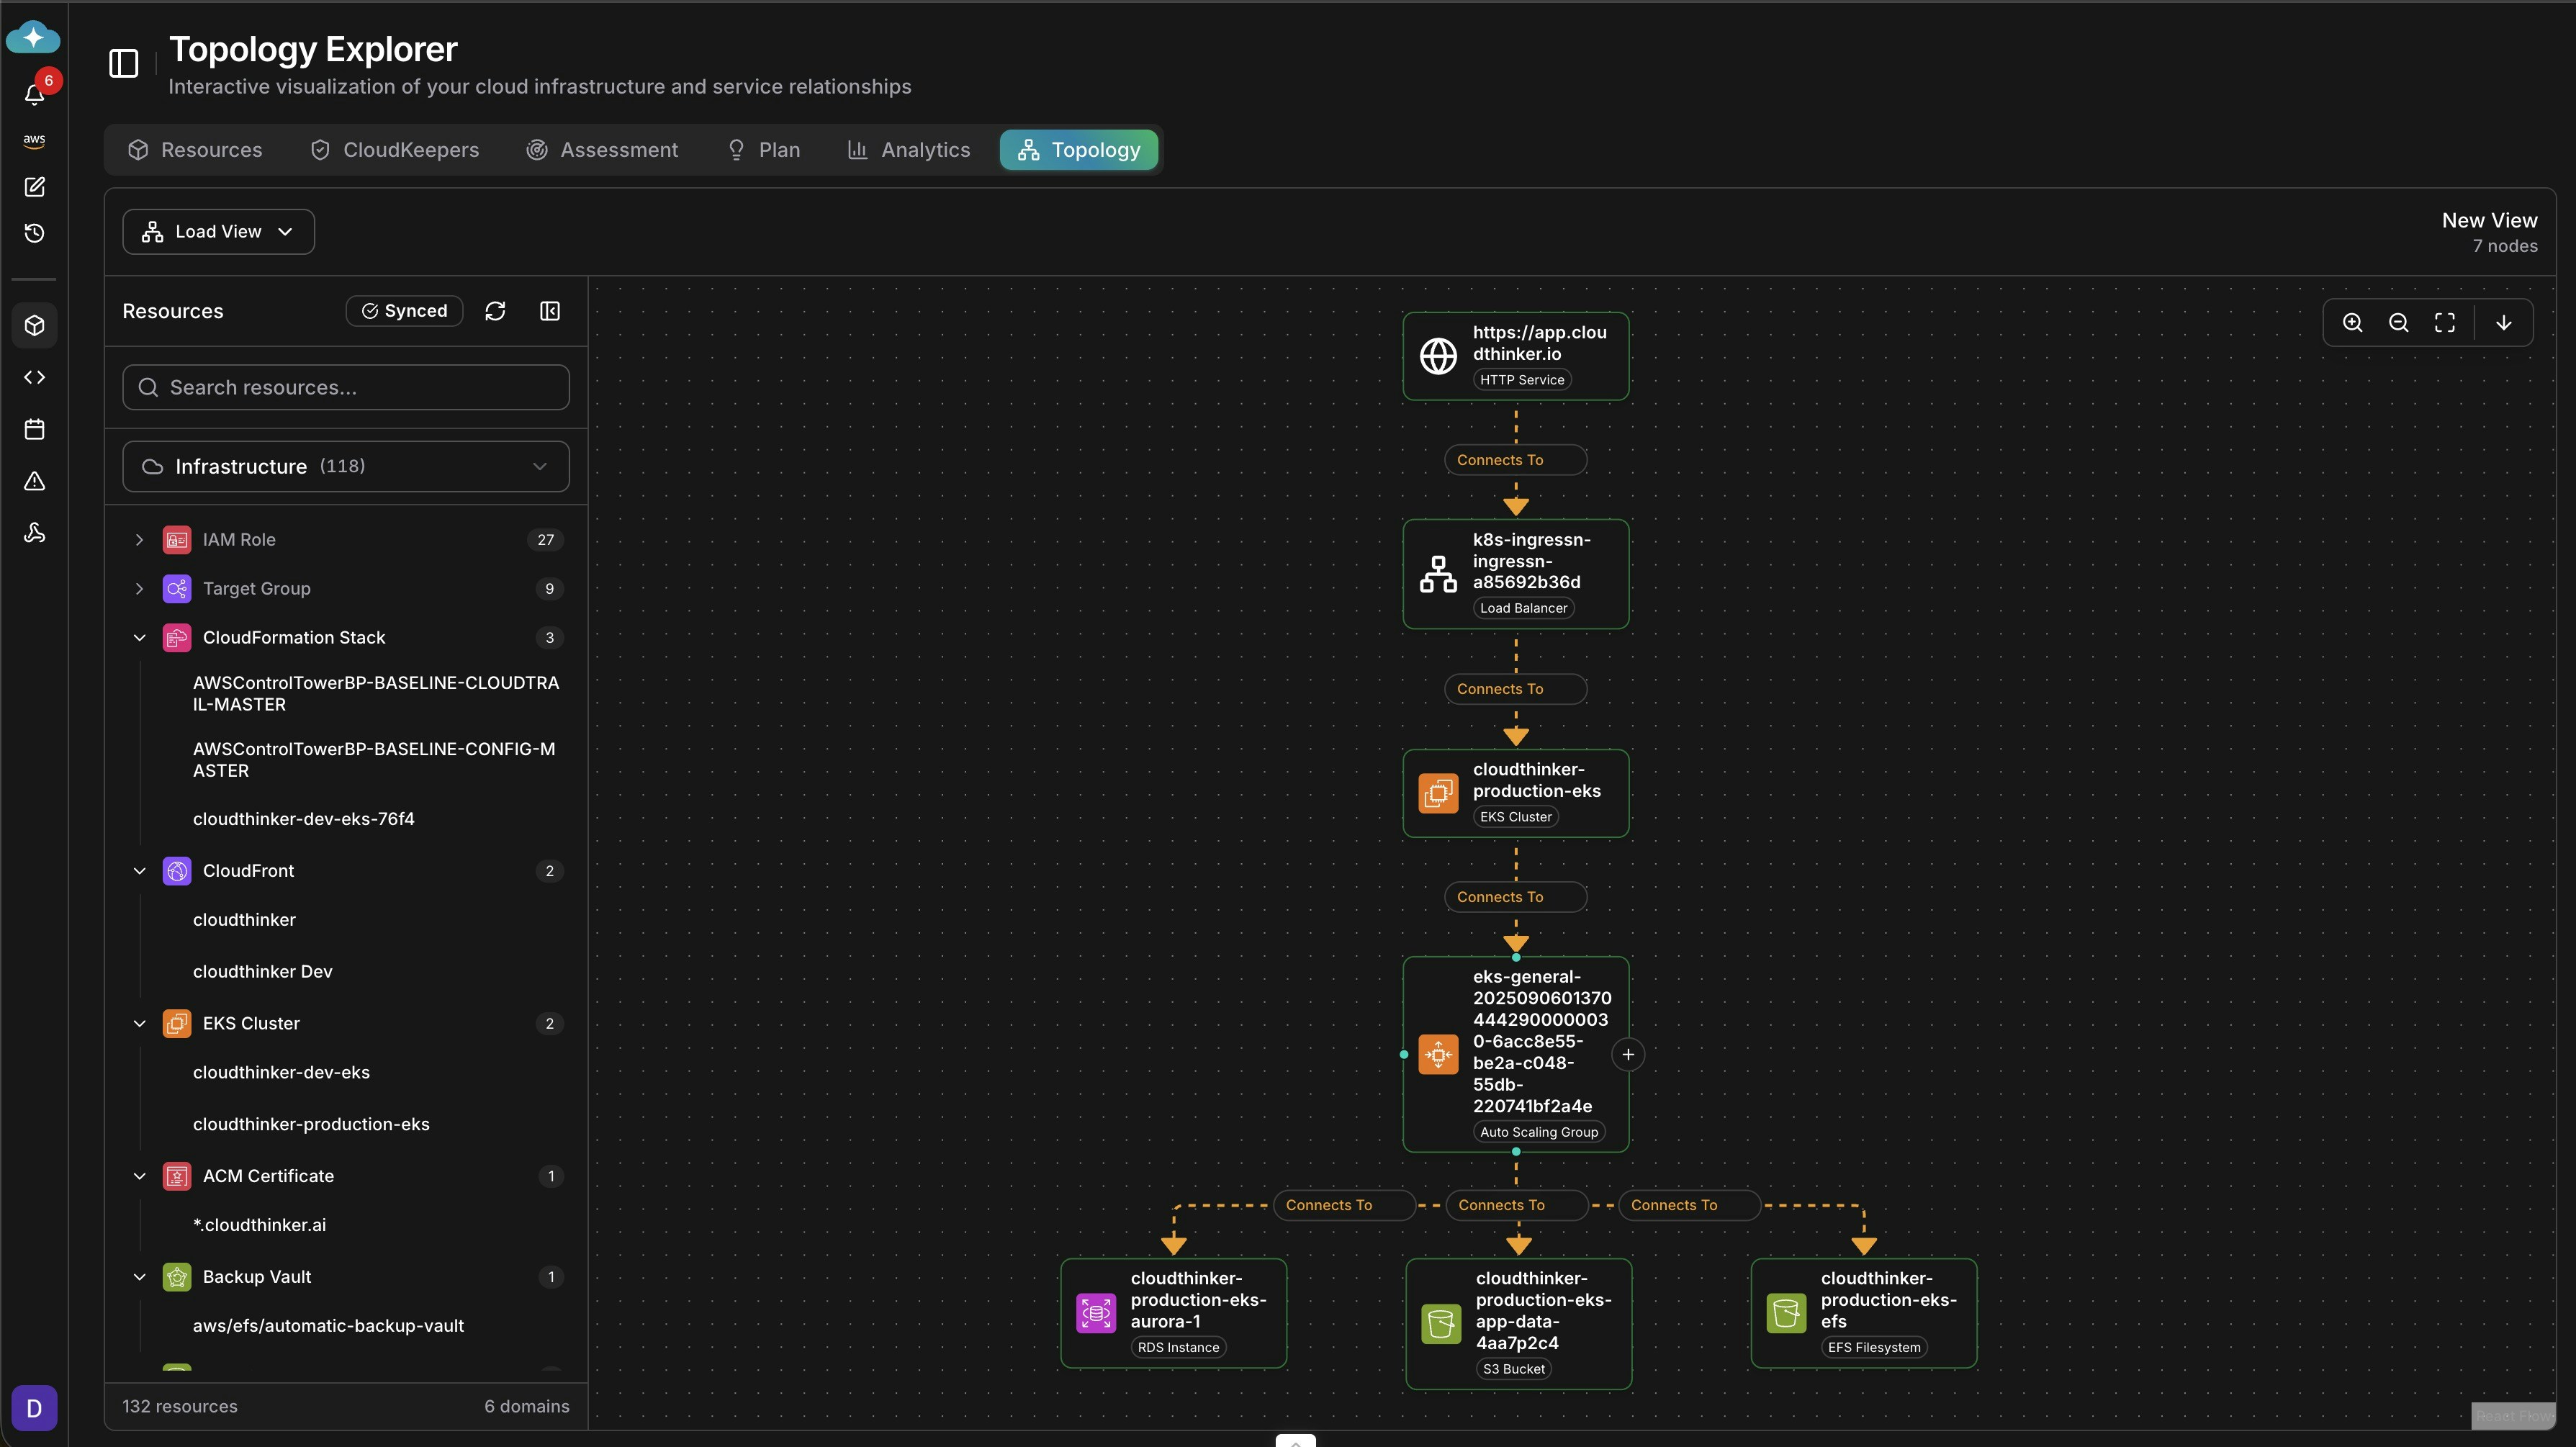
Overview
Topology maps help you:- Visualize relationships between cloud resources
- Understand dependencies across services
- Support incident response with visual context
- Enable root cause analysis (RCA) by tracing connections
- Document architecture for team knowledge sharing
Building Topology
- Agent-Led Discovery
- Import from IaC
- Manual Builder
Let CloudThinker agents automatically discover and map your infrastructure.Benefits:
- Automatic resource discovery
- Real-time relationship mapping
- Continuous sync with infrastructure changes
Resource Types
The Topology Explorer supports all major cloud resource types:| Category | Resources |
|---|---|
| Compute | EC2, Lambda, ECS, EKS, VMs, Cloud Run |
| Networking | VPC, Load Balancers, CloudFront, API Gateway |
| Database | RDS, Aurora, DynamoDB, Cloud SQL |
| Storage | S3, EFS, EBS, Cloud Storage |
| Security | IAM Roles, Security Groups, ACM Certificates |
| Kubernetes | Clusters, Deployments, Services, Pods |
Using Topology for Incident Investigation
Topology maps are invaluable during incidents:Root Cause Analysis (RCA)
Impact Analysis
Visualize blast radius and affected services:Real-Time Status
During incidents, topology shows:- Health status of each resource
- Connection states between services
- Error propagation paths
- Recovery progress visualization
Views and Filters
Load View
Access saved topology views from the Load View dropdown.Filter Resources
Use the search and filter panel to:- Search by resource name or ID
- Filter by resource type (EC2, RDS, EKS, etc.)
- Filter by tags or metadata
- Show/hide resource categories
Sync Status
The Synced indicator shows when topology was last updated from your infrastructure.Agent Integration
Agents use topology for enhanced analysis:Example Prompts
Export Options
Export topology for documentation and sharing:- PNG/SVG - Static image export
- PDF - Printable documentation
- JSON - Machine-readable format
- Share Link - Collaborative viewing
Real-World Use Cases
Production Outage Response
Scenario: Your payment service is down and customers can’t complete orders.- Payment service connects to RDS Aurora (primary database)
- Aurora connects to ElastiCache (session cache)
- ElastiCache shows unhealthy status ← Root cause identified
Cloud Migration Planning
Scenario: Migrating from on-premises to AWS. Need to understand what moves together.- Wave 1: Stateless web services (low risk)
- Wave 2: Application servers with database dependencies
- Wave 3: Core databases with replication setup
- Wave 4: Final cutover with traffic routing
Security Incident Investigation
Scenario: Security alert - unusual traffic from an EC2 instance.- Compromised instance has access to 3 S3 buckets
- Connected to production RDS via security group
- Blast radius: 12 downstream services
Cost Optimization Discovery
Scenario: Monthly AWS bill spiked 40%. Need to find the cause.- Orphaned load balancers with no targets: $180/month
- Oversized RDS instance (db.r5.4xlarge) for dev: $2,400/month
- Idle EKS node group running 24/7: $1,200/month
Compliance Audit Preparation
Scenario: SOC 2 audit next month. Need to document data flows.- Visual data flow diagrams for auditors
- Encryption coverage map (gaps highlighted in red)
- Network segmentation proof
- Access control visualization
Disaster Recovery Testing
Scenario: Validate DR plan before annual test.- DR missing ElastiCache cluster
- Lambda functions not replicated
- S3 cross-region replication not enabled for 2 buckets
New Engineer Onboarding
Scenario: New team member needs to understand the architecture.Kubernetes Service Mesh Debugging
Scenario: Intermittent 503 errors in production.- Ingress → API Gateway → Order Service → Inventory Service
- Inventory Service pod: CrashLoopBackOff
- Root cause: OOMKilled due to memory leak
Root Cause Analysis (RCA) for Errors
Scenario: Application throwing “Connection refused” errors intermittently.- Web App → Load Balancer → API Server → Database
- API Server shows healthy
- Database connection pool: Exhausted ← Root cause
- Upstream cause: Slow query holding connections
Performance Degradation Analysis
Scenario: API response times increased from 200ms to 2 seconds.- Database latency spiked from 20ms to 1800ms
- Missing index on new query pattern
- Table scan on 50M rows
Cascading Failure Investigation
Scenario: Multiple services failing simultaneously.- T+0: Redis cluster failover triggered
- T+5s: Session service lost cache → returning errors
- T+10s: Auth service failing → can’t validate tokens
- T+15s: All downstream services rejecting requests
Memory Leak Detection
Scenario: Service restarts every few hours in production.- Order Service: Memory growing 50MB/hour
- Connected to: Message Queue, Database, Cache
- Leak source: Unclosed database connections after queue processing
Network Latency Troubleshooting
Scenario: Cross-service calls timing out randomly.- Services in different availability zones
- NAT Gateway: Throughput limit reached
- Cross-AZ traffic: 2ms → 200ms during peak
Database Connection Issues
Scenario: “Too many connections” errors during peak traffic.Related
Resources
View all discovered infrastructure resources
Assessment
Run infrastructure assessments