Documentation Index
Fetch the complete documentation index at: https://docs.cloudthinker.io/llms.txt
Use this file to discover all available pages before exploring further.
The evolution of data visualization in cloud operations
Traditional BI platforms were designed for slow-changing data and long reporting cycles. However, modern cloud environments operate at a high velocity where infrastructure scales dynamically and performance shifts in minutes. This speed demands visualization capabilities that match the pace of change, providing instant visibility into system patterns and resource utilization. Beyond speed, the challenge is accessibility—traditional visualization is often siloed among specialists, creating significant organizational bottlenecks.Challenges with traditional reporting workflows
Manual delays: Reports require SQL writing, data export, visualization configuration, and review cycles by completion, data represents historical rather than current state Siloed expertise: Business teams depend on DBAs or analysts with competing priorities and limited capacity, limiting iterative exploration Cross-system correlation: Modern applications span multiple databases and AWS services (RDS, Cost Explorer, CloudWatch, custom databases), each requiring different credentials, query languages, and export formats consuming hours or days of specialist timeSolution: CloudThinker’s agentic approach to data visualization
CloudThinker uses specialized AI agents that understand natural language and technical infrastructure, delivering dashboards in minutes. This approach breaks down traditional silos by automatically gathering data from across your entire ecosystem—without requiring users to know which systems to query or how to correlate the information.Implementing ad-hoc visualization with CloudThinker
CloudThinker provides secure, read-only access across your entire cloud environment, turning natural language prompts into precise, actionable dashboards instantly.Intelligent Agent Capabilities
Instead of manual configuration, CloudThinker’s agents automatically map your requests to the relevant data, providing expertise across three core areas:- Performance & Health: Instantly analyze system metrics and workload efficiency to pinpoint bottlenecks and maintain peak performance.
- Resource & Cost Operations: Gain deep visibility into utilization patterns and spending trends to ensure your entire ecosystem remains cost-effective.
- Cross-Domain Intelligence: Connect the dots across your technical stack, correlating performance data with operational impact for a truly holistic view.
Mastering perception commands and prompt patterns
CloudThinker uses three primary perception commands. Here are proven prompt templates for each: AWS Cost Analysis: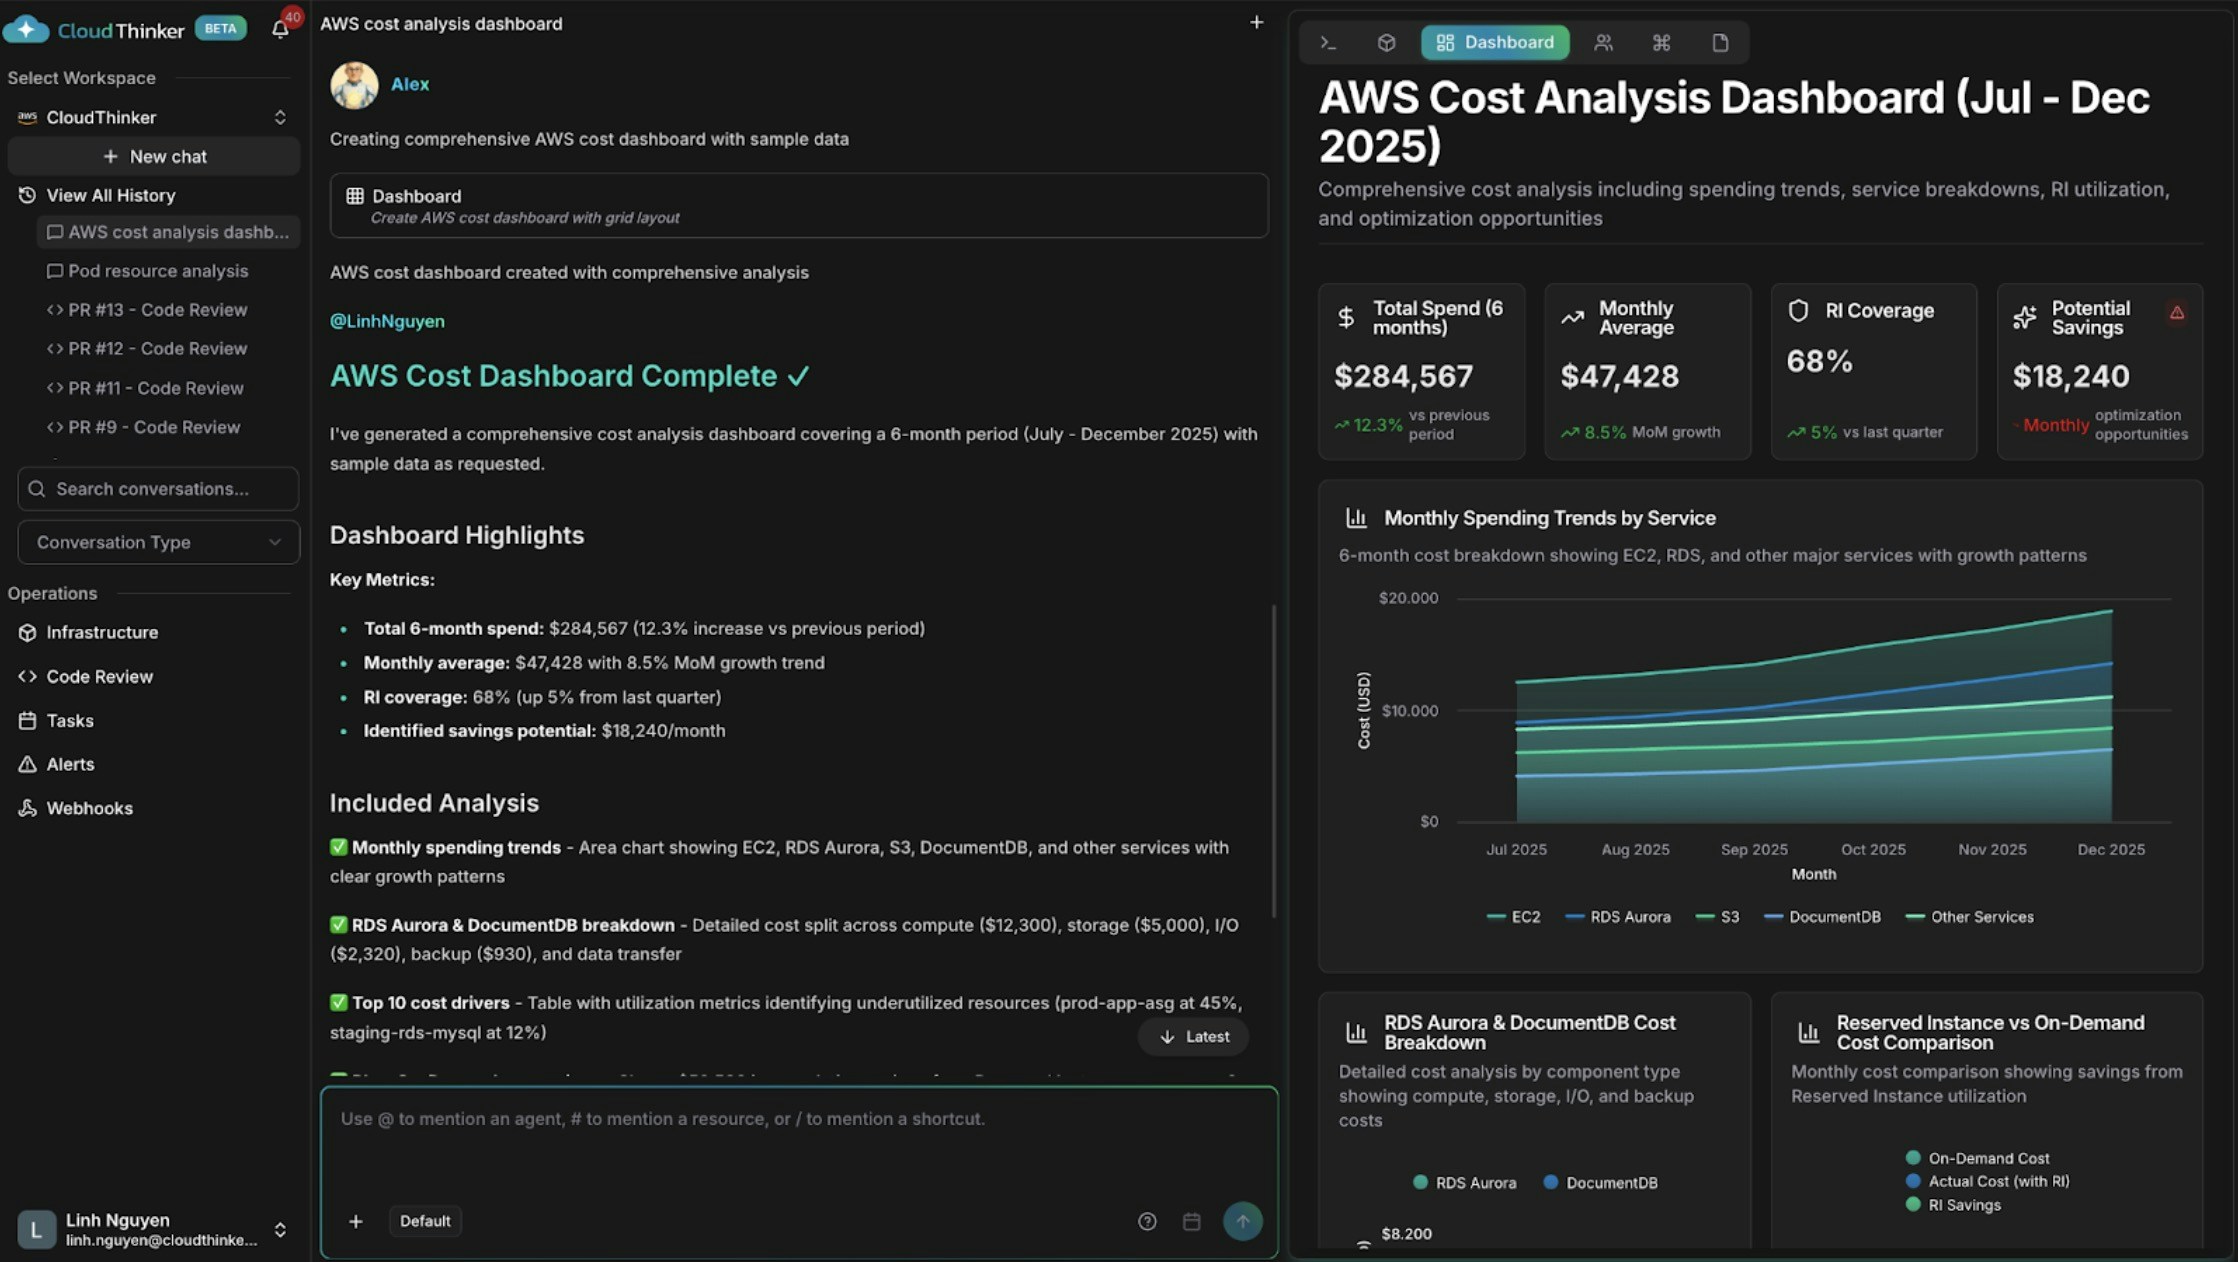
AWS cost dashboard with spending trends and cost drivers
Cross-Domain Database & Infrastructure Analysis: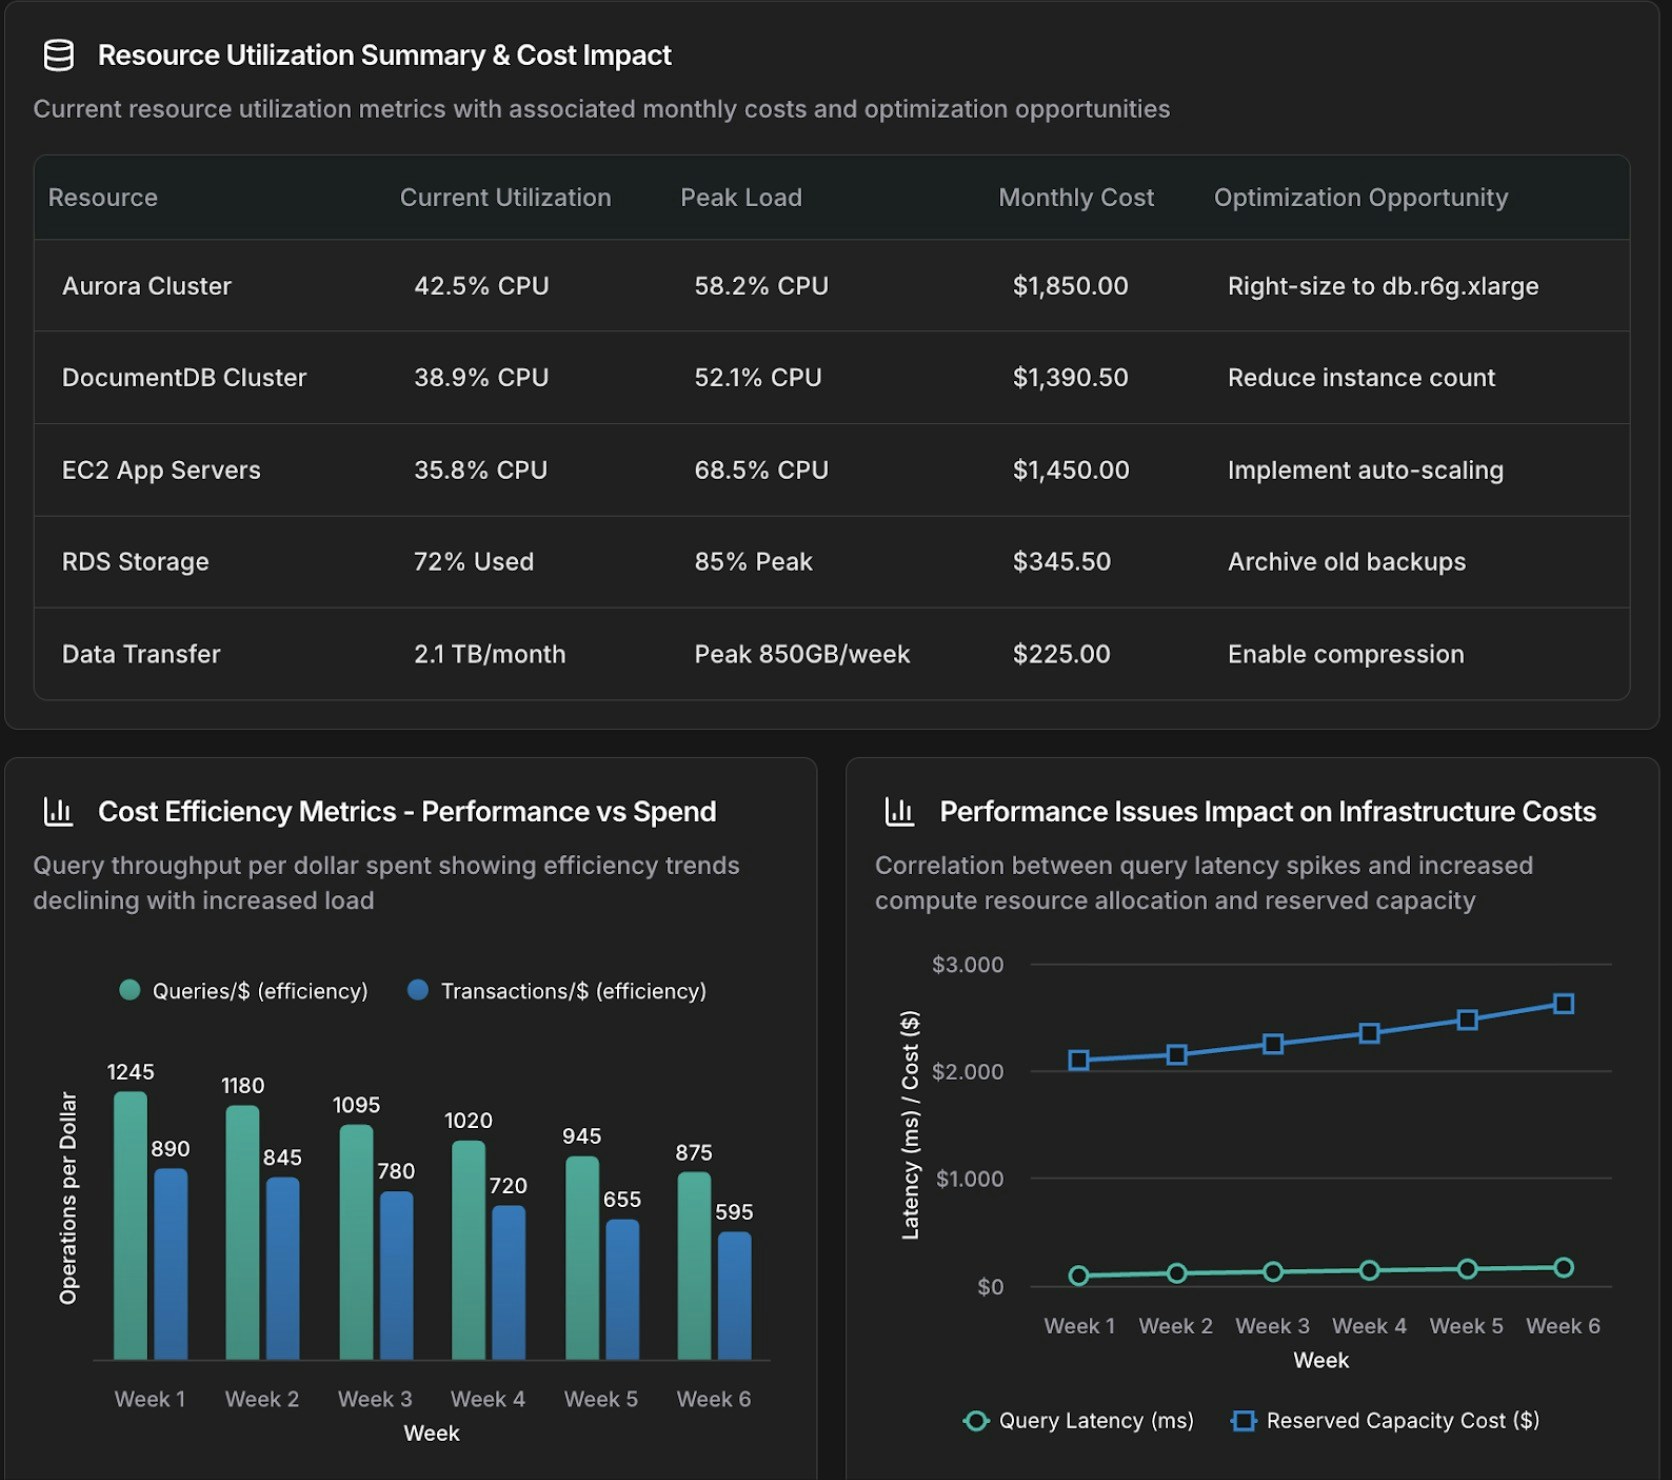
Database and infrastructure correlation dashboard
Chart Command Patterns
The chart command generates focused visualizations for specific analyses: Aurora Query Performance Time-Series: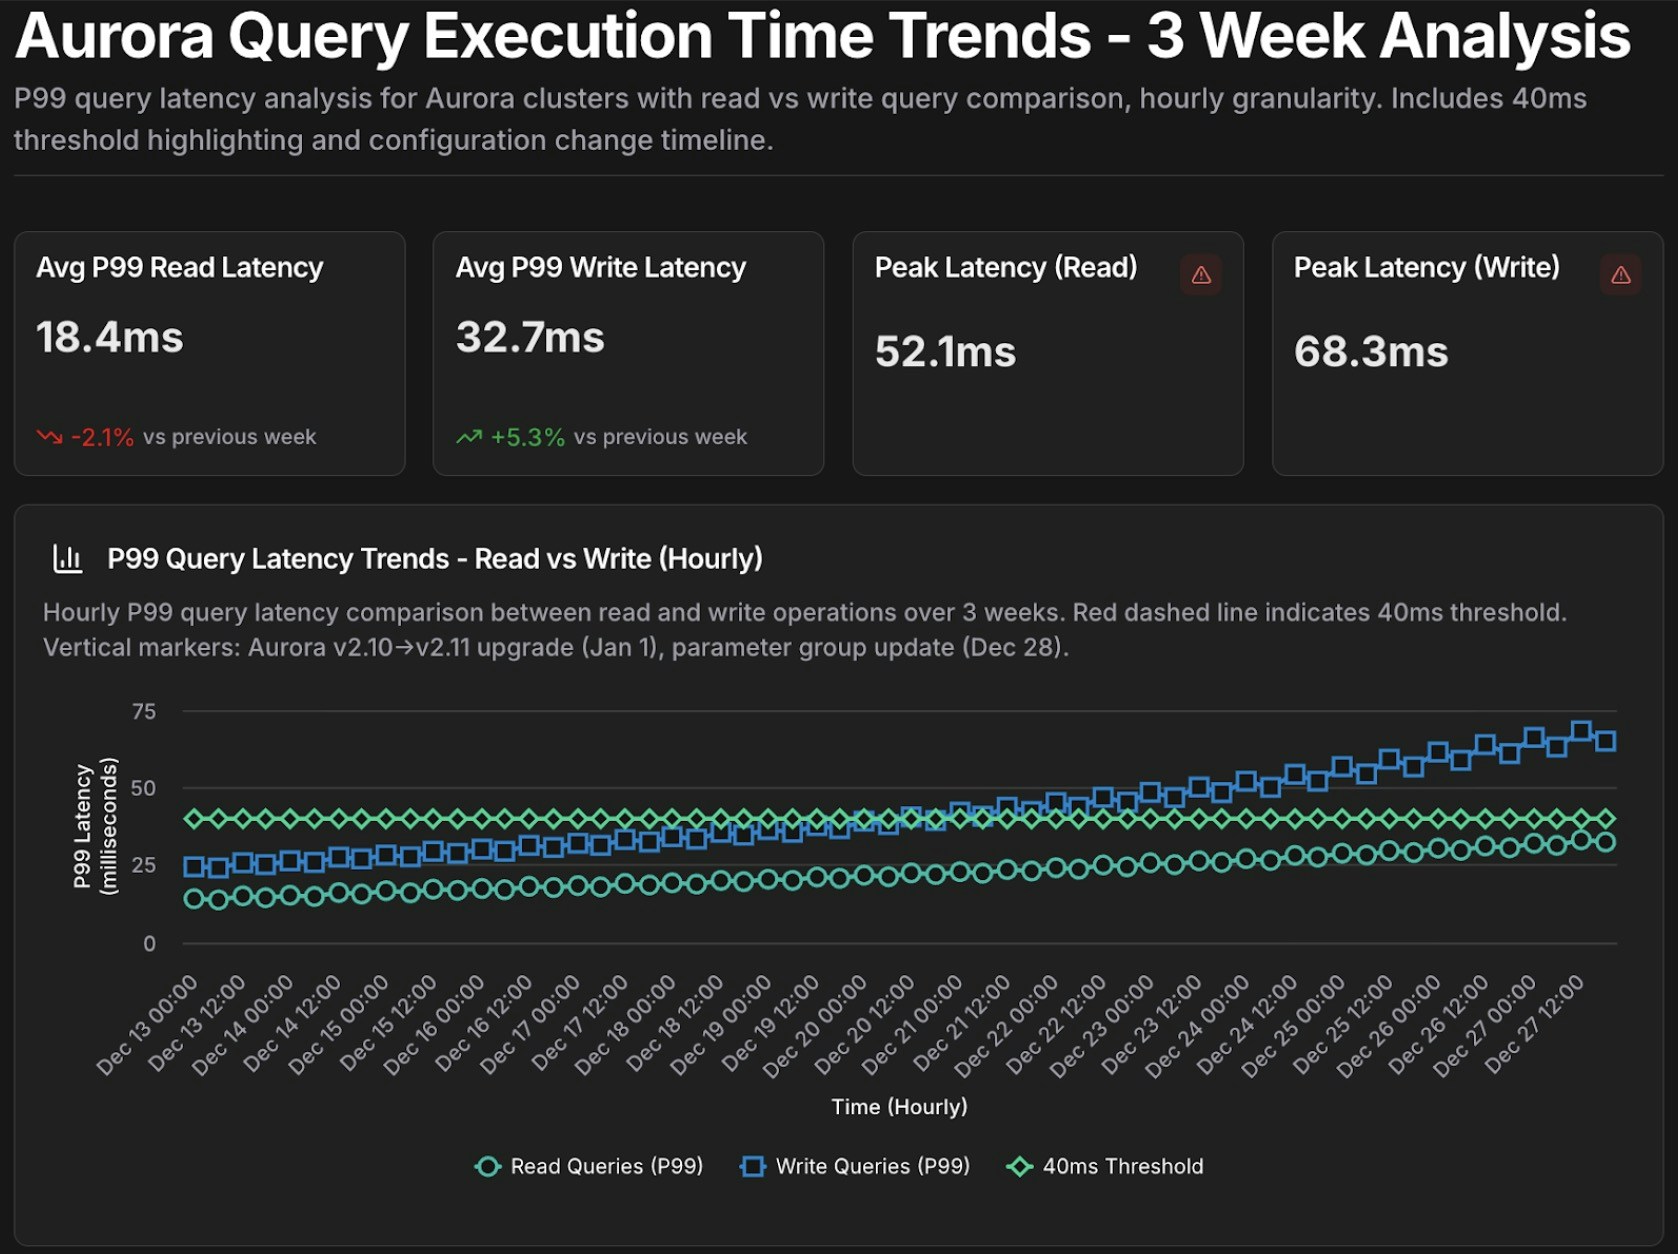
Aurora query performance time-series chart
Parameterized Templates for Recurring Analysis: Create reusable templates for common investigations: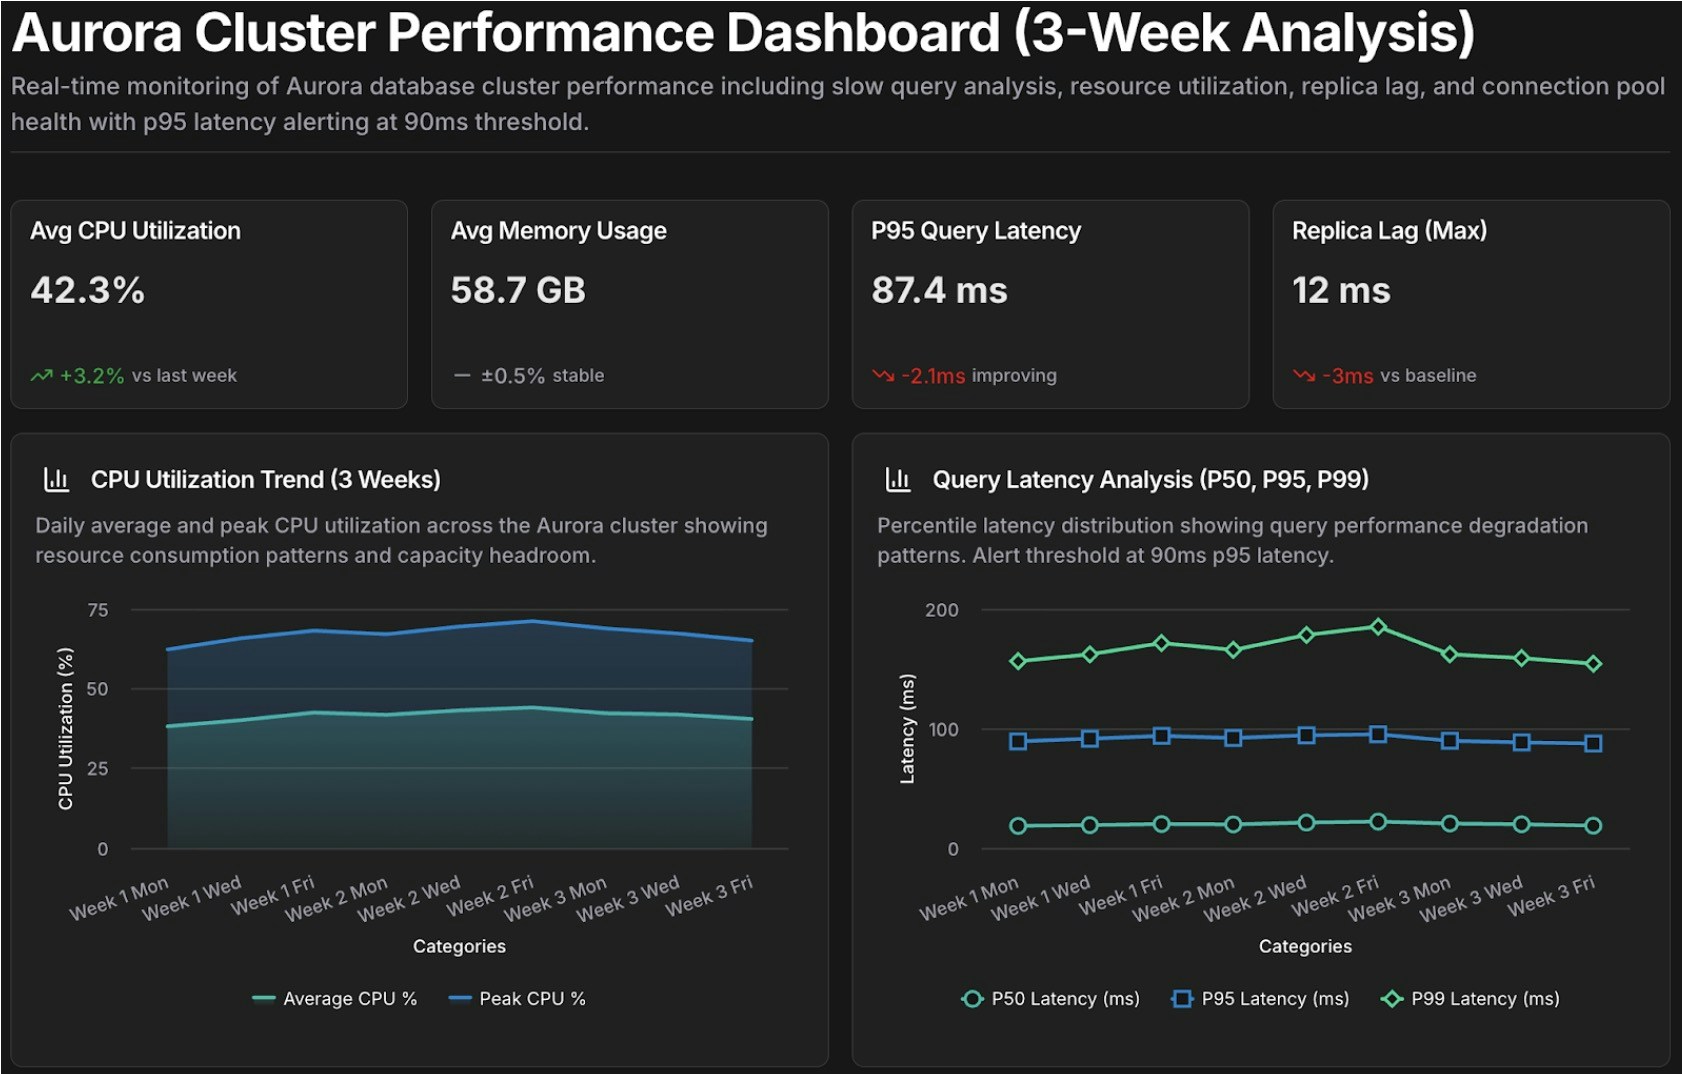
Performance review dashboard template
Comparing CloudThinker with traditional business intelligence approaches
| Dimension | Traditional BI Platforms | CloudThinker |
|---|---|---|
| Time to Insight | Hours to Days: Requires ETL, pipelines, and manual design. | 2–5 Minutes: Instant dashboards from natural language questions. |
| Required Expertise | Specialized: Requires SQL, schema knowledge, and BI tool training. | Universal: Natural language only; accessible to all stakeholders. |
| Context & Intelligence | Static: Displays raw metrics; requires manual interpretation. | Diagnostic: Explains root causes and provides actionable advice. |
| Cross-System Analysis | Siloed: Manual synthesis required across different data sources. | Unified: Automatically correlates data across the entire ecosystem. |
| Monitoring Model | Reactive: Periodic reports with visibility gaps between cycles. | Proactive: Continuous monitoring with real-time anomaly detection. |
| Accessibility | Bottlenecked: Dependent on technical teams and request queues. | Democratized: Self-service access for any team member. |
| Iteration Speed | Slow: Follow-up questions require new development cycles. | Rapid: Iterative exploration and refinement in minutes. |
| Infrastructure | Heavy: Requires warehouses, ETL pipelines, and maintenance. | Light: SaaS-based; connects directly to existing accounts. |
| Cost Structure | High: Licensing, infra costs, and high specialist headcount. | Efficient: Subscription-based; reduces infra and labor overhead. |
| Deployment Time | Months: Extensive modeling and integration phases. | Minutes: Immediate setup without data modeling. |
What’s Next
Cost Analytics
Dive deeper into cloud spend trends, forecasts, and cost attribution analysis
Infrastructure Analytics
Correlate performance, cost, and reliability signals across all connected clouds
CloudKeepers
Set up autonomous pilots to continuously monitor cost and security guardrails
Language Reference
Master the full
@agent #tool syntax for building effective dashboards