

How an investigation runs
- Trigger — an incident is created, either automatically when a Pulse cluster escalates or manually from the incident detail page. Cluster escalations inject the cluster summary and all member signals into the agent’s context, so investigation starts with the full signal history loaded. CloudThinker queues an RCA task in the background and opens a dedicated AI conversation.
- Agent activation — Anna coordinates the investigation while specialists cover their domains, based on your connected infrastructure.
- Context gathering — agents explore infrastructure topology, collect baseline metrics, identify affected services, and examine recent deployments and configuration changes.
- Analysis — agents form competing hypotheses and test each one against logs, traces, and dependencies.
- Resolution — the confirmed hypothesis becomes the root cause. Evidence is curated, remediation suggestions are generated, and a disposition is set with a confidence score.
Agents investigate in parallel across these domains and correlate findings in real time. Root causes surface even when symptoms appear far from the underlying issue.
Investigation phases
RCA follows a structured three-phase workflow. When agents move to a new phase, the previous phase completes automatically if still in progress.
Agents must gather supporting evidence and investigate for sufficient time before confirming any hypothesis.
Setting a disposition is mandatory to close an investigation. Without it, the incident remains in Investigating status.
Evidence chain
RCA builds a structured evidence chain with automatic calculations. Each item can link to a specific hypothesis to show which findings support each theory.
Evidence is ranked by severity: Critical (direct cause) → High (strong support) → Medium (context) → Low (background).
Confidence scoring
Every identified root cause carries a confidence score from 0.0 to 1.0.
Confidence rises with temporal correlation, metric anomalies above 50% deviation, matching error patterns, ruled-out alternatives, and multiple corroborating data sources. It falls with alternative explanations, weak temporal correlation, missing verification, or conflicting evidence.
Hypothesis tracking
RCA runs hypothesis-driven investigation inspired by “5 Whys” and Fishbone methodologies.
Agents confirm at least one hypothesis before setting a root cause, and resolve every hypothesis — confirmed or ruled out — before closing the investigation.
An example hypothesis chain from a latency incident:
Investigation timeline
RCA streams a real-time timeline of every investigation step, showing phase progress, hypothesis testing, and evidence collection with timestamps. Each investigation holds up to 100 entries (enforced at the database level).Disposition
Every investigation concludes with a disposition, which updates the incident status.
After disposition is set, the incident can progress through additional lifecycle statuses (Resolved, Post-Mortem, Closed) as your team completes follow-up actions.
Start an investigation
Automatically
Configure webhook integrations to auto-trigger RCA. When an incident meets the severity threshold, the investigation starts in the background:Manually
1
Open the incident detail page
Select the incident you want to investigate.
2
Click Start RCA Analysis
CloudThinker validates that no duplicate RCA is running, then starts the investigation within 1–3 seconds. Timeline entries appear in real time as agents discover findings.
Reading the results
You can run multiple investigations on the same incident with version tracking (v1, v2, v3…). Rerun RCA when new information becomes available or the first run was inconclusive, and compare results from the history dropdown.
Example: EC2 terminations and EKS network failures
Continuous monitoring surfaced two interconnected findings in one workspace: frequent EC2 instance terminations andCreateNetworkInterface failures on EKS. Here is how the agents investigated them together.
First, Alex analyzes the termination pattern:
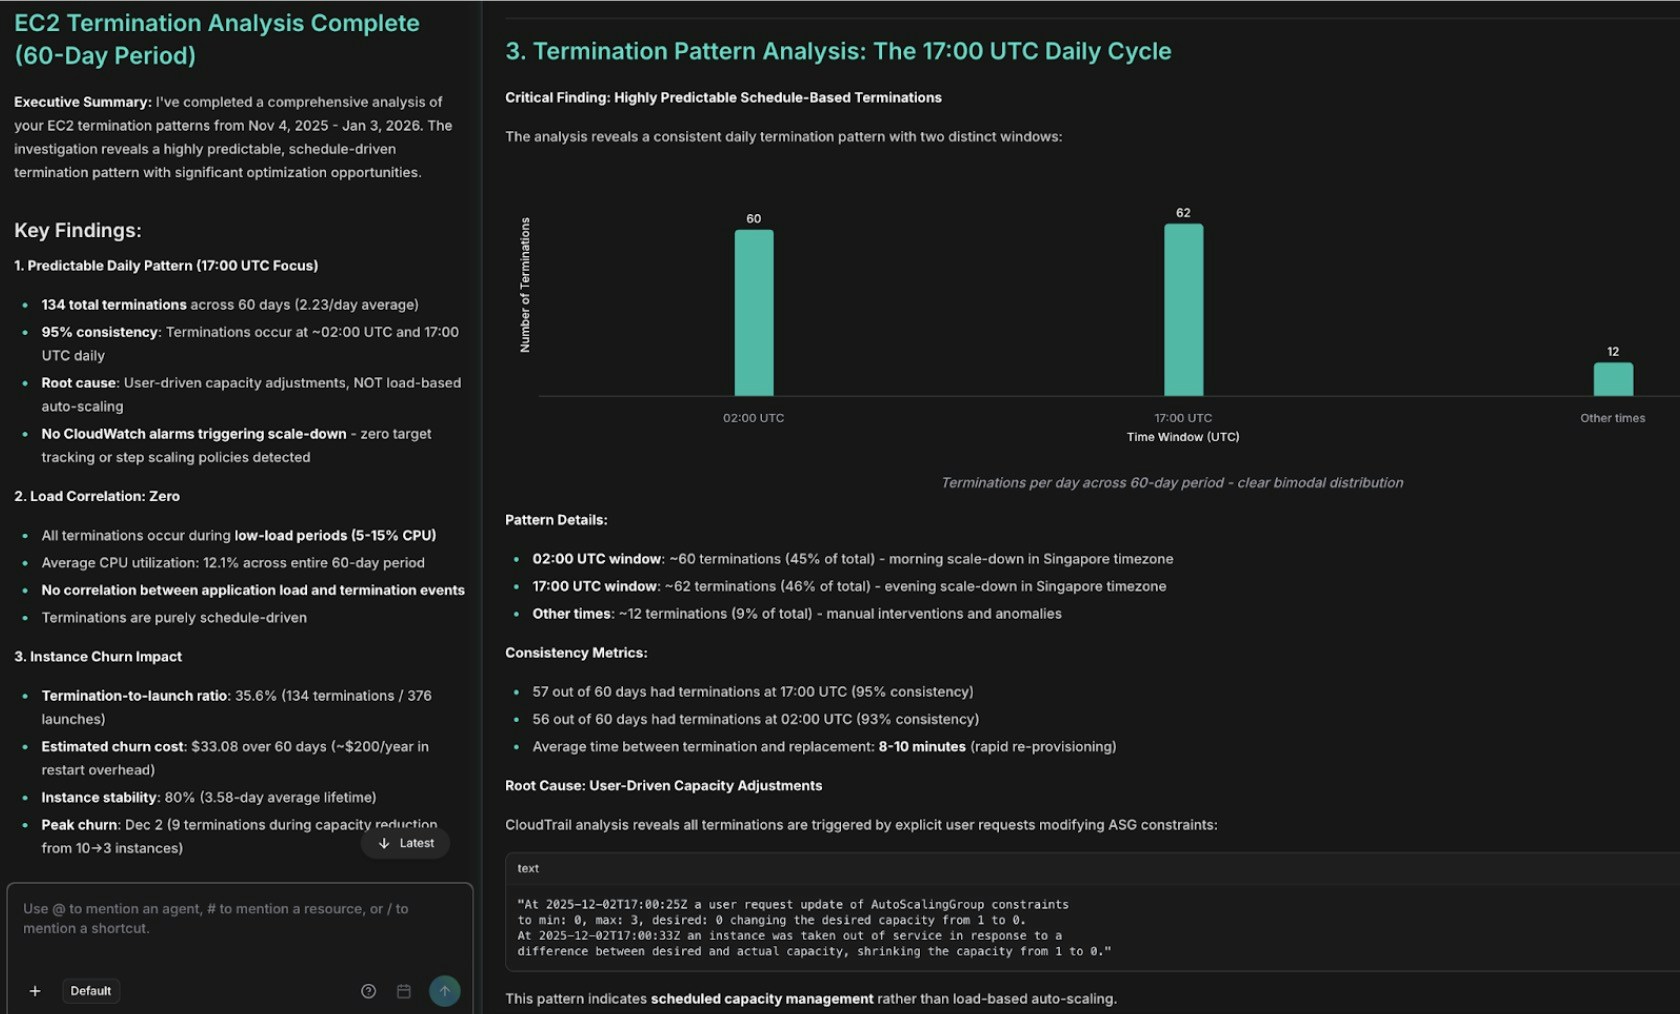
EC2 termination pattern analysis showing AutoScaling events
Next, Alex cross-correlates the network failures with the terminations: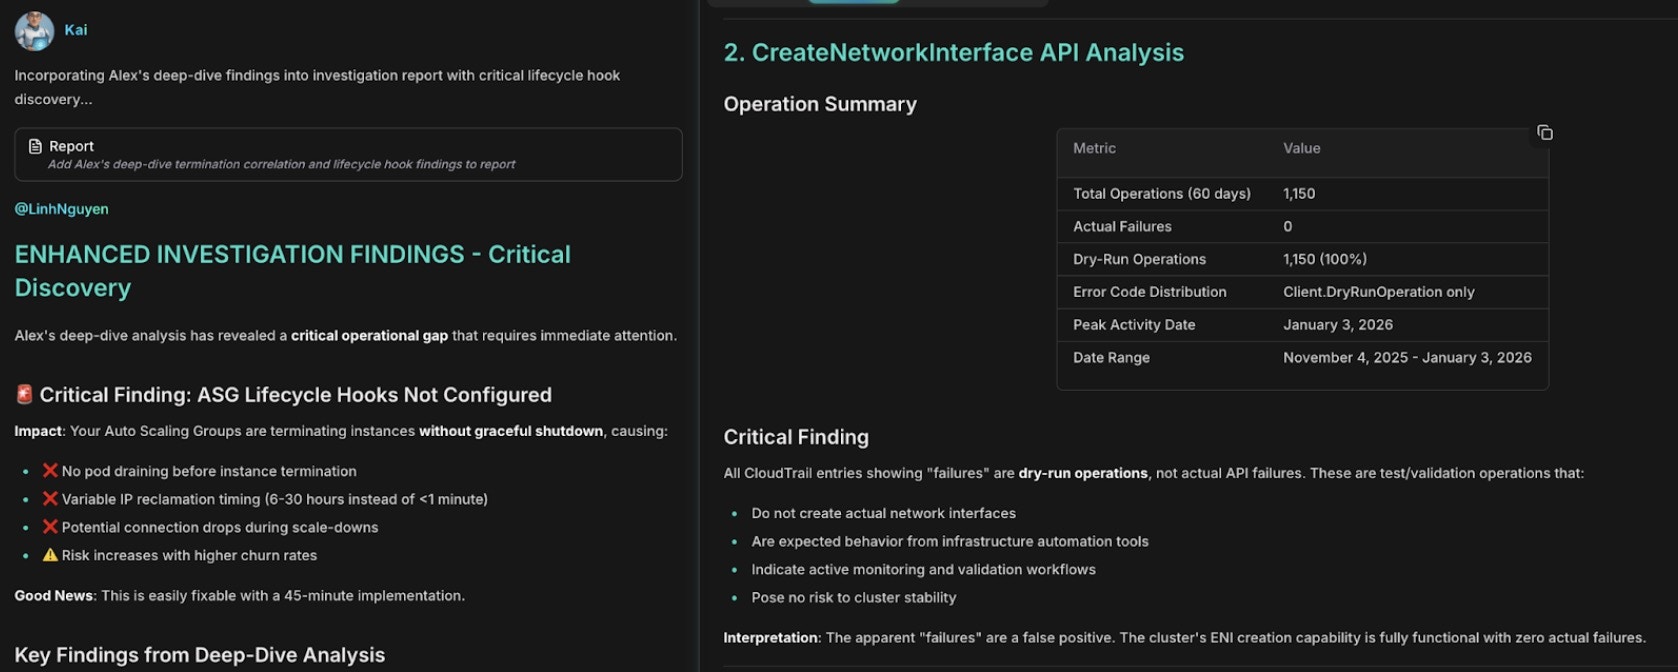
Network failure correlation with CreateNetworkInterface errors and IP exhaustion
Finally, Anna synthesizes the findings from Alex (infrastructure and cost), Kai (EKS networking), and Oliver (security) into one document: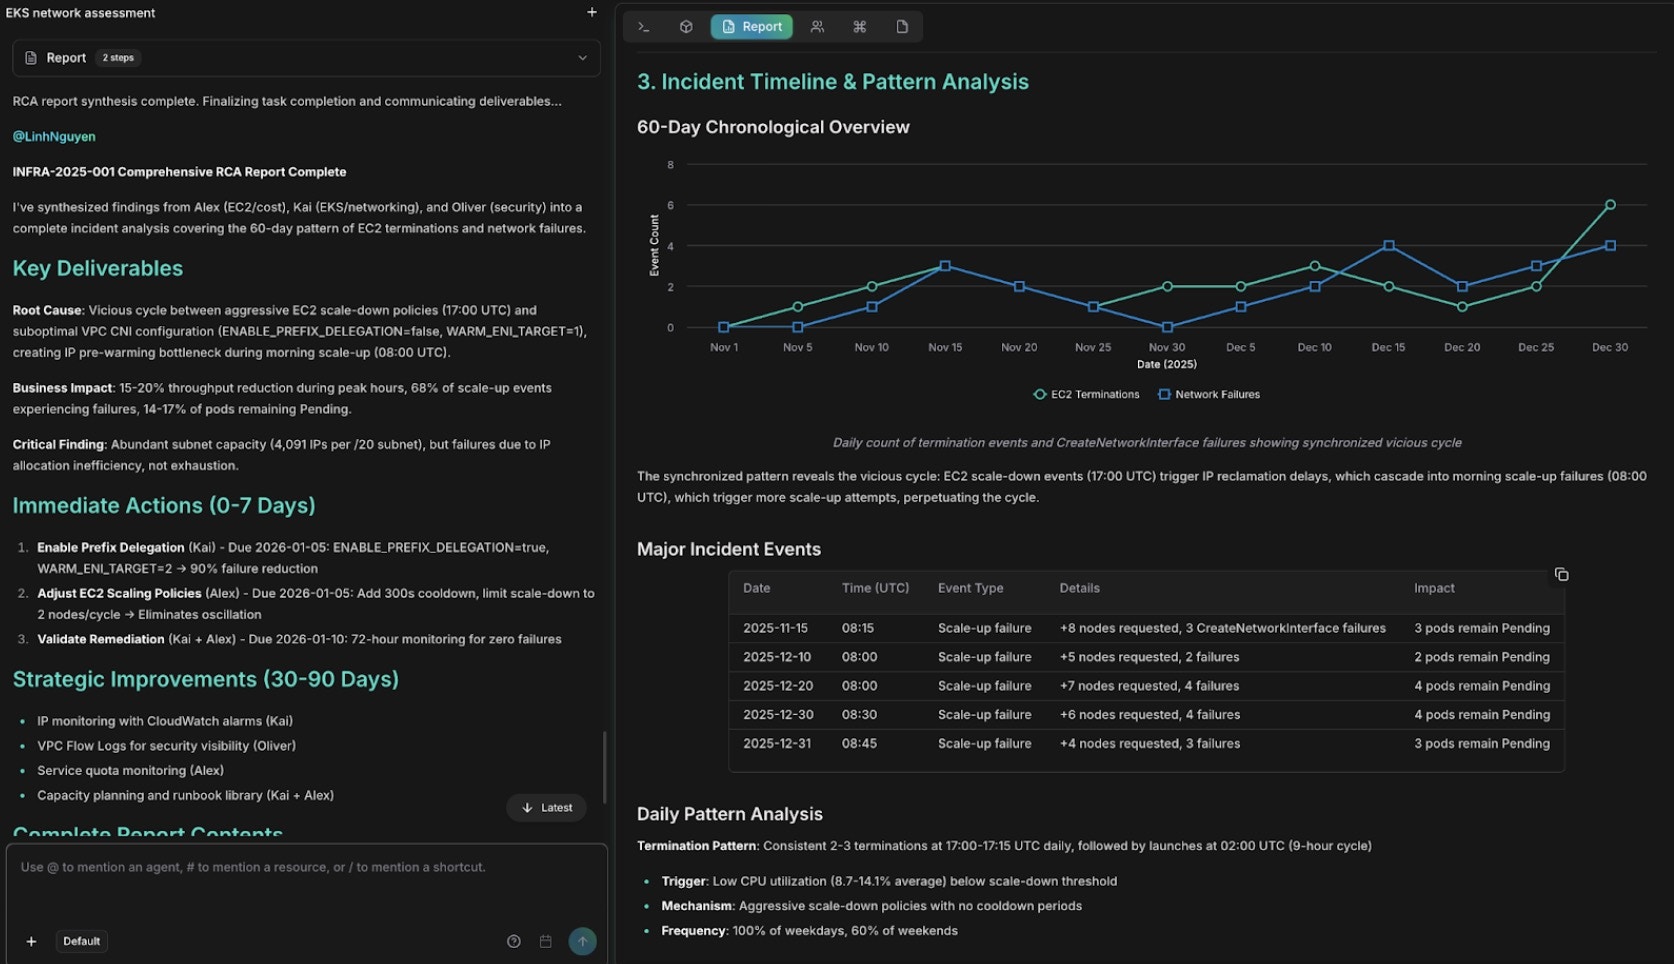
Comprehensive RCA report with findings and remediation steps
Best practices
- Connect topology before incidents happen — blast radius analysis and service correlation depend on it.
- Configure webhooks to auto-trigger RCA for medium and higher severity incidents.
- Add context to the incident description; it guides where agents look first.
- Watch the timeline during the investigation to follow which hypotheses were tested and ruled out, and verify evidence timestamps correlate with incident start.
- Validate the root cause manually before remediating when confidence is below 0.7, and start with critical-priority remediation actions.
- Connect Runbooks so agents can find and execute remediation procedures during future investigations.
Related
Pulse
Upstream signal intelligence that suppresses noise and escalates actionable clusters into incidents
Webhook integrations
Auto-trigger RCA from PagerDuty, Datadog, Prometheus, and more
Topology
Build live dependency maps for faster blast radius analysis during incidents
Runbooks
Connect operational runbooks so agents can execute remediation steps