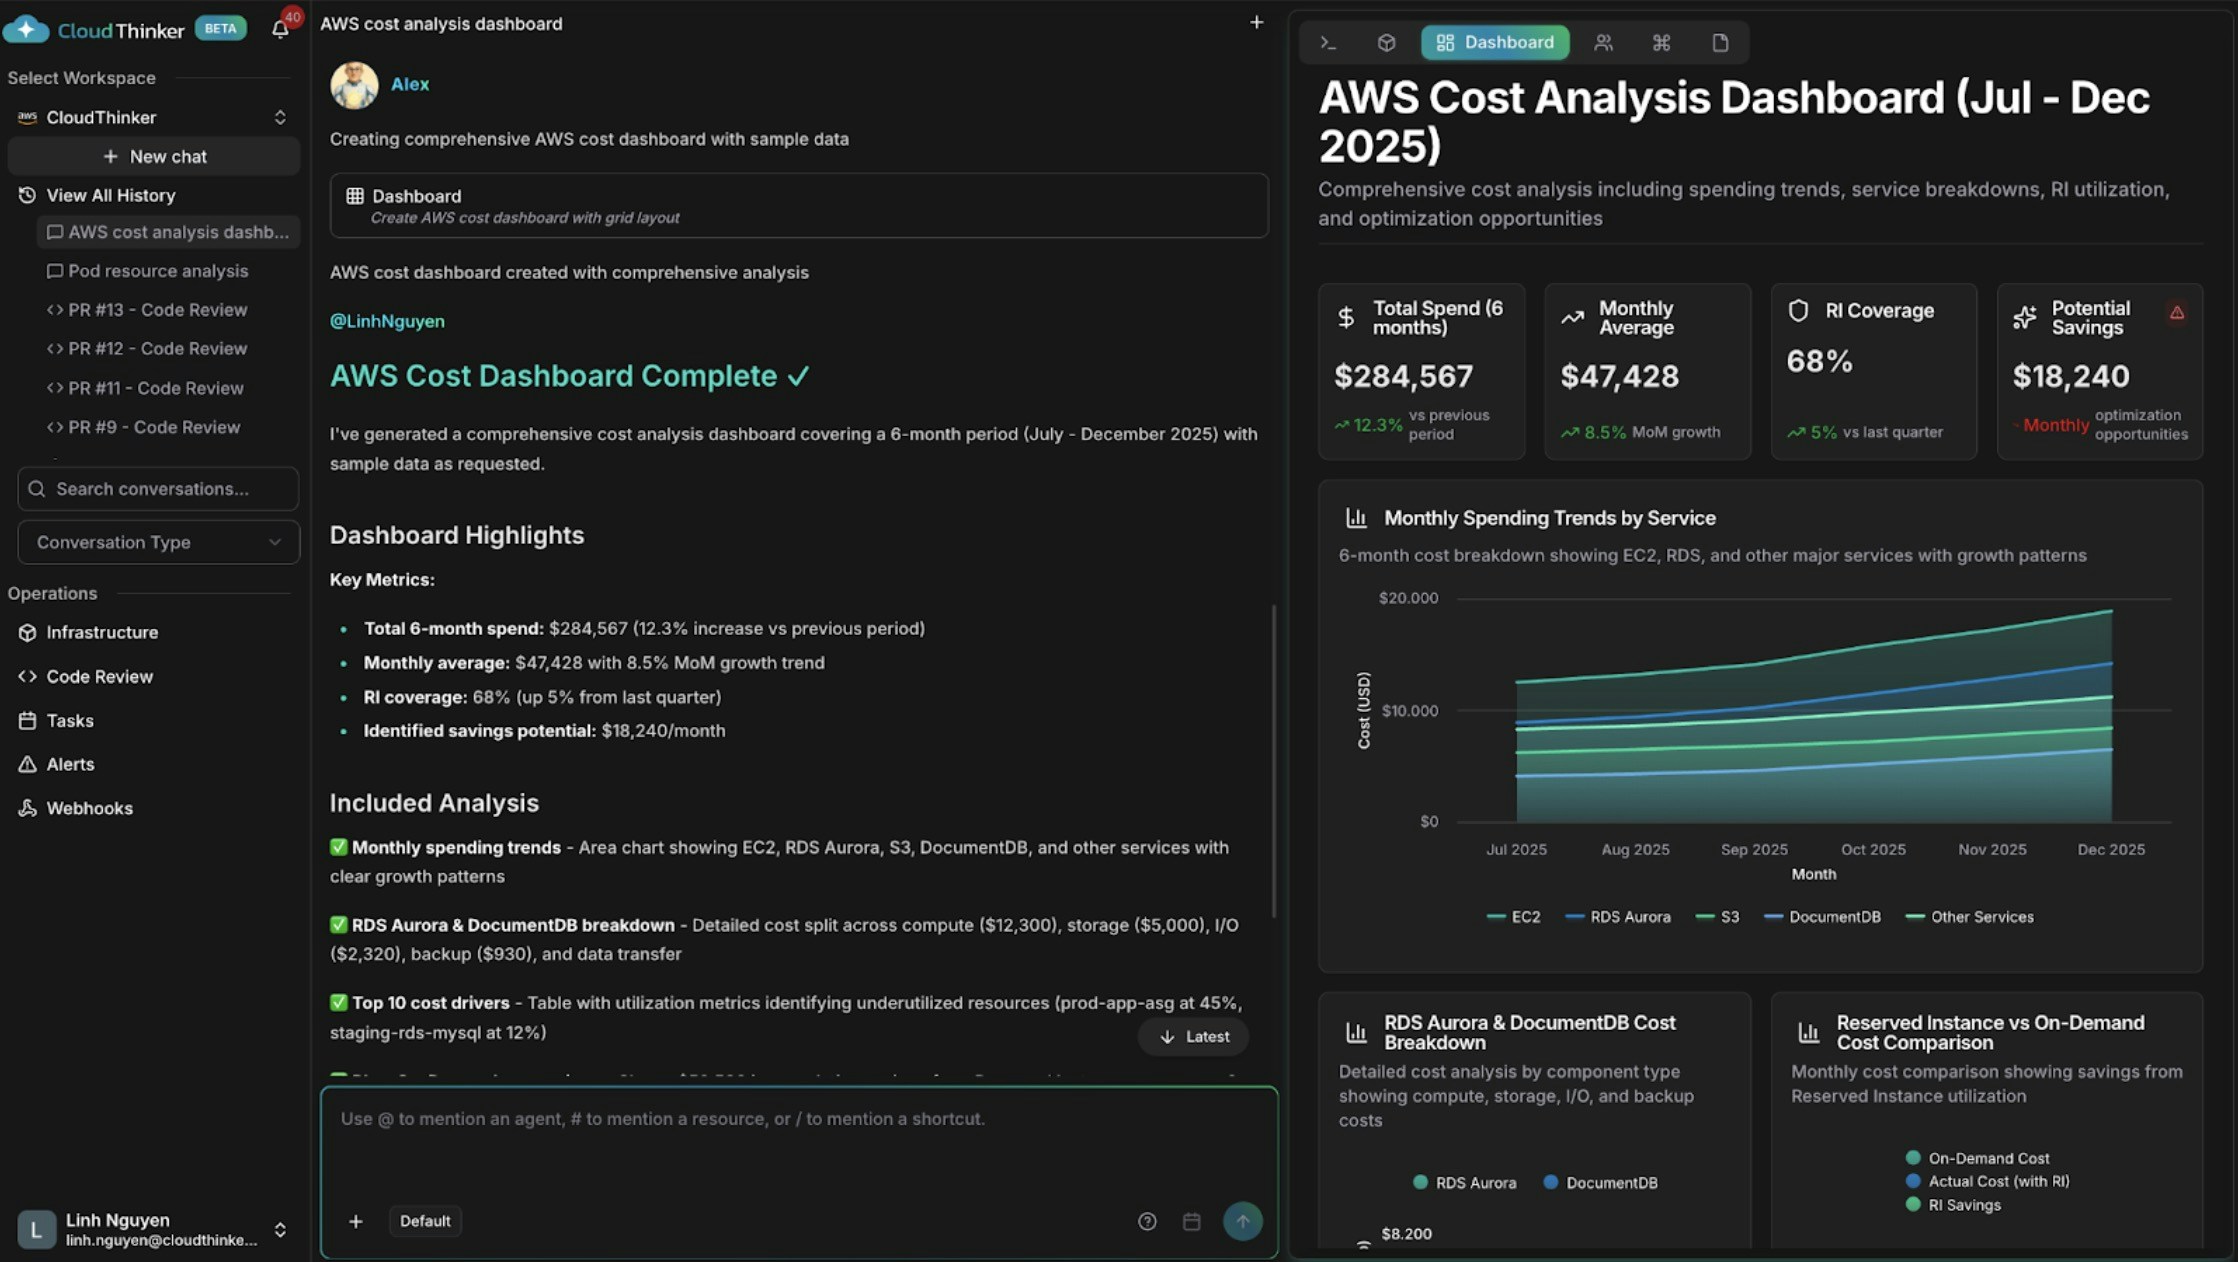
Artifacts는 CloudThinker 에이전트가 연결된 클라우드 데이터로부터 생성하는 대시보드, 리포트, 차트입니다. 필요한 인사이트를 자연어로 설명하면, 에이전트가 몇 분 안에 데이터 기반 시각화를 만들어냅니다.클라우드 리포트를 수작업으로 만들려면 비용, 보안, 모니터링 도구에서 데이터를 가져와 형식을 맞추고 요약해야 합니다 — 빠르게 낡아지는 전문가 작업에 수 시간이 걸립니다. CloudThinker의 #dashboard, #report, #chart 도구는 단일 프롬프트로 동일한 결과물을 만들어내며, 모든 연결에서 데이터를 통합합니다.
한 줄 요청으로 시작하세요 — 에이전트가 범위와 시간 범위에 대한 합리적인 기본값을 선택합니다:
@alex #dashboard AWS spending by service for the last 30 days@oliver #report quarterly security assessment across all accounts@kai #dashboard cluster resource utilization
@alex #dashboard Generate a comprehensive AWS cost dashboard for [start_date] to [end_date].Include:- Monthly spending trends by service with month-over-month growth rates- Top 10 cost drivers and their utilization patterns- Reserved Instance vs On-Demand cost comparison- Cost anomalies and optimization opportunities with estimated savingsSegment by: [cost allocation tags such as environment, team, or application]
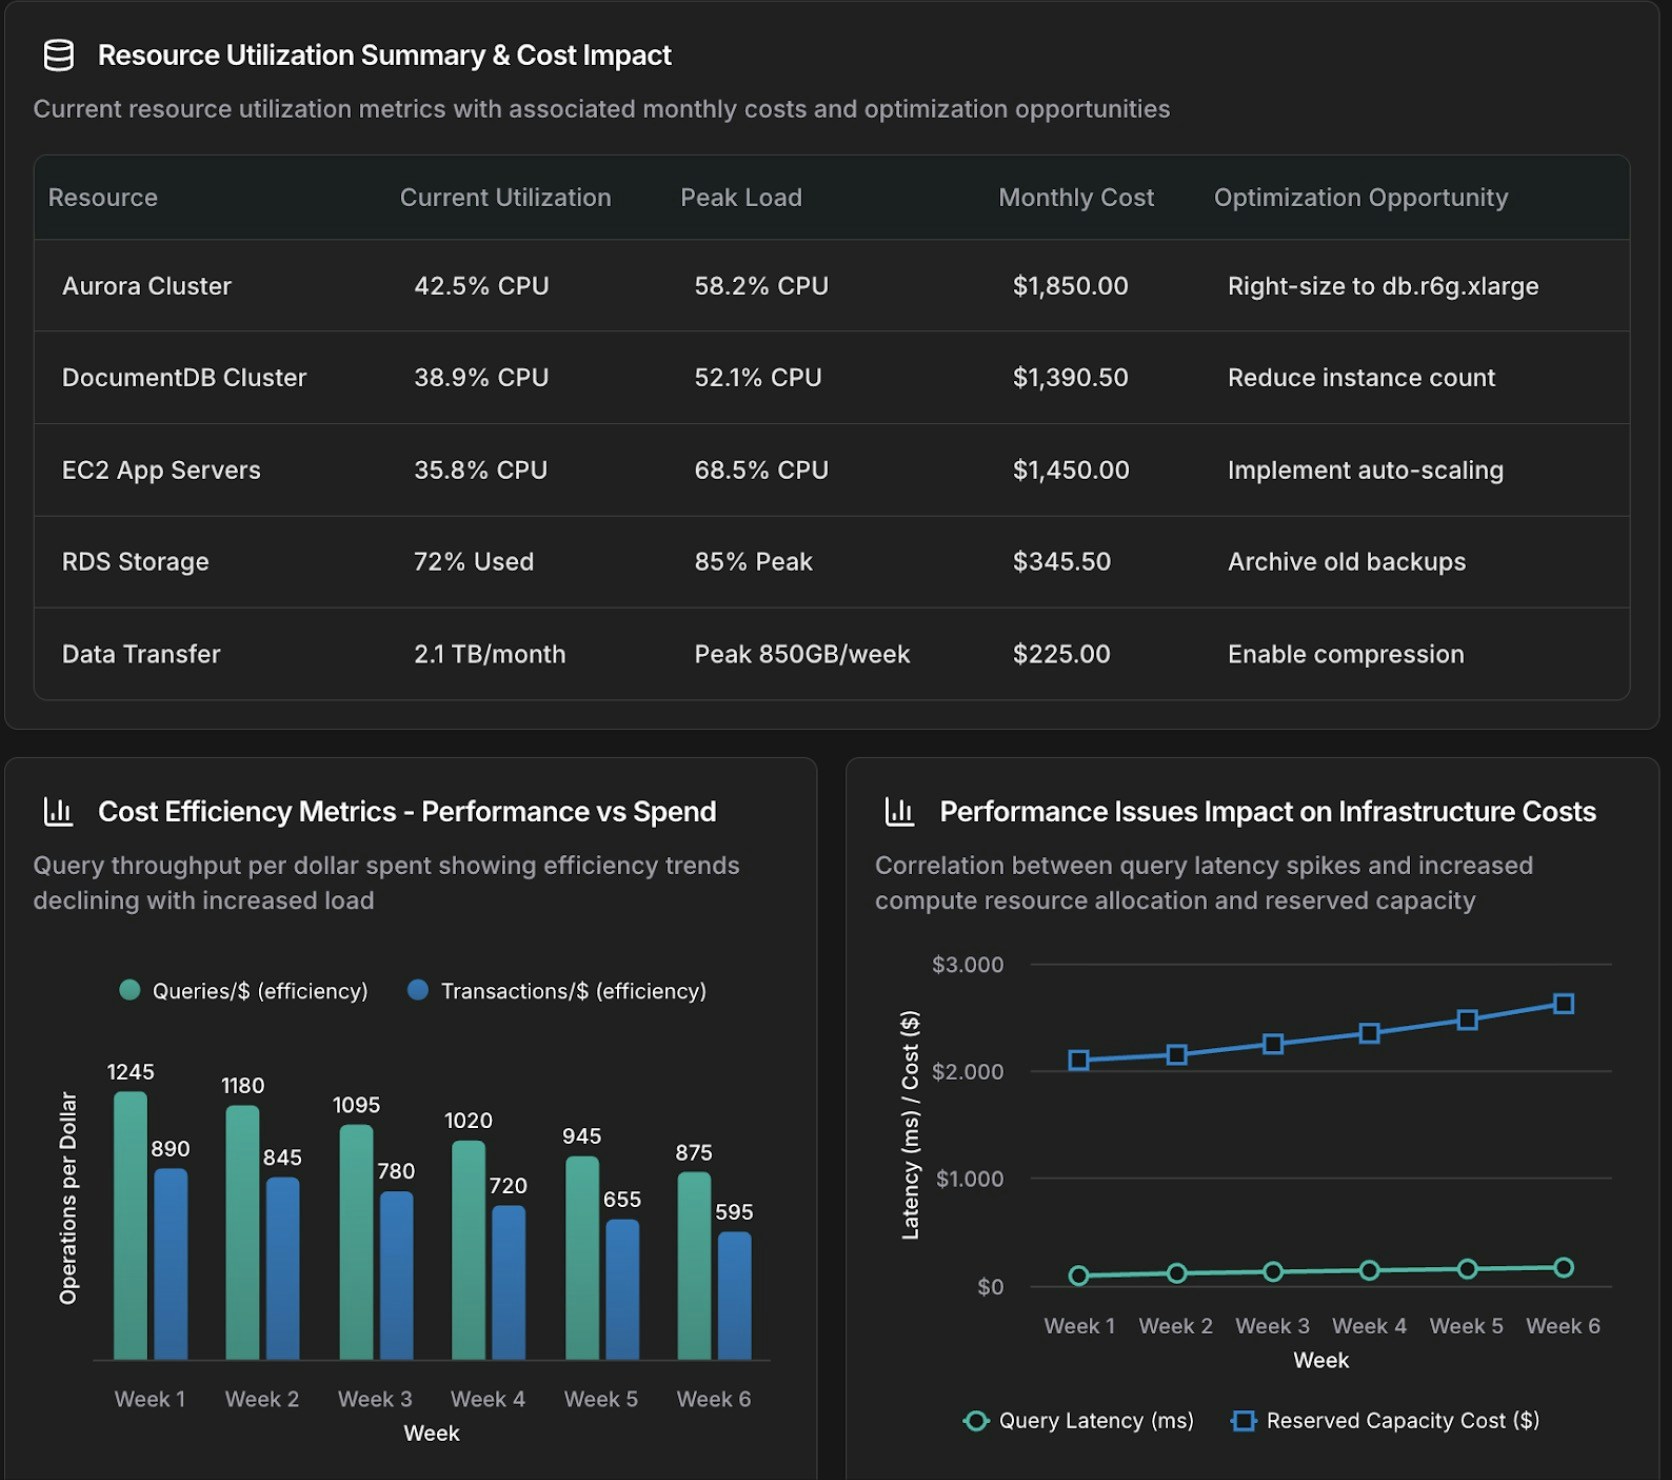
@anna #dashboard Create an operational dashboard correlating database performance with infrastructure costs for [time_period].Analyze:- Aurora and DocumentDB query performance metrics- Resource utilization and spending patterns- Correlation between database load and compute and storage costsContext: [recent changes, migrations, or specific concerns]
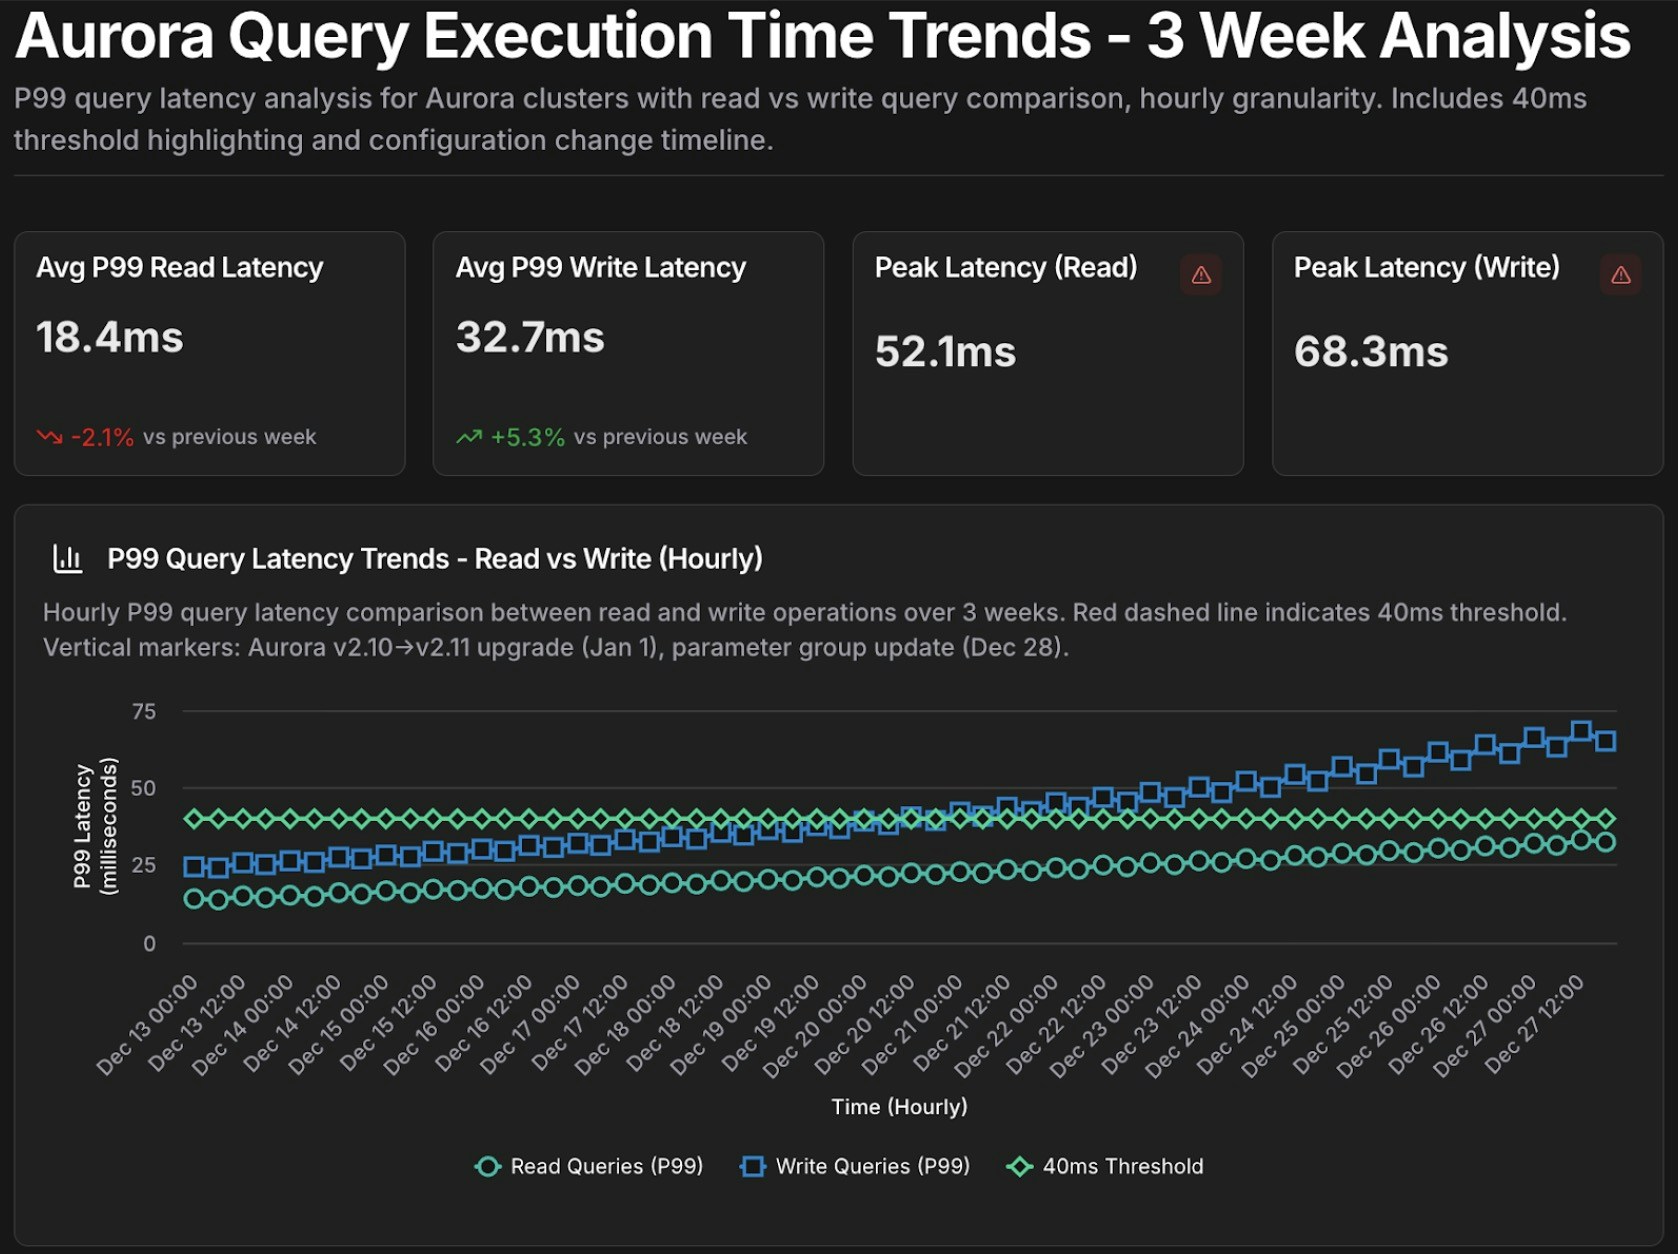
@tony #chart Show query execution time trends for Aurora cluster [cluster-identifier] over the past [time_period].- Metrics: p50, p95, p99 query latency- Separate lines for read queries vs write queries- Highlight queries exceeding [threshold] ms
매개변수화된 프롬프트를 반복 조사를 위한 템플릿으로 저장하고, 매번 {변수}를 채워 실행하세요:
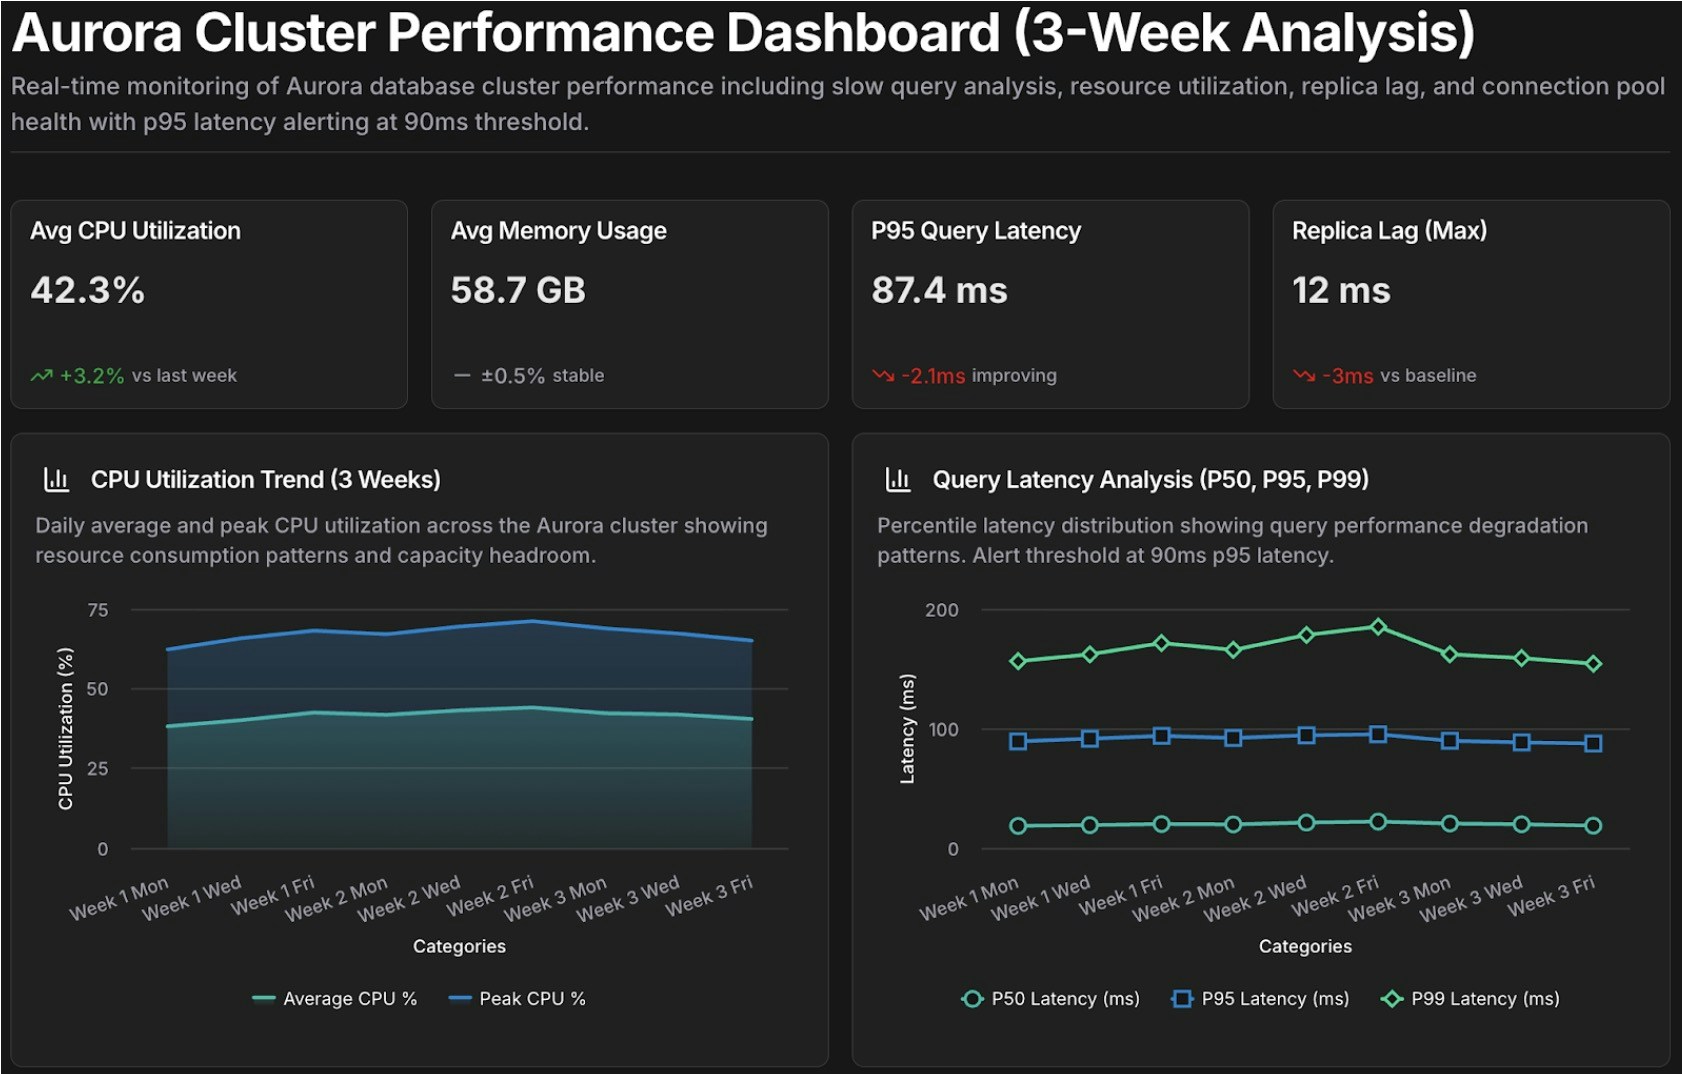
Template: database_performance_review@tony #dashboard Create a performance dashboard for Aurora cluster {cluster_id} covering {time_period}.Include:- Slow query analysis (queries exceeding {latency_threshold} ms)- Resource utilization trends (CPU, memory, IOPS)- Replica lag monitoring- Connection pool healthCompare against baseline: {comparison_period}Alert on: queries exceeding p95 latency of {latency_threshold} msTemplate: cost_anomaly_investigation@alex #report Investigate the cost anomaly for {service_name} on {date}.- Compare costs to the 7-day and 30-day averages- Break down by cost component (compute, storage, I/O, data transfer)- Identify the specific resources driving the increase and quantify the impact- Recommend immediate actions to mitigate ongoing cost increases
예를 들어, cluster_id=production-aurora-cluster, time_period="past 7 days", comparison_period="previous 30 days", latency_threshold=200으로 database_performance_review를 실행합니다.