Supported platforms
Incident management
PagerDuty
Authentication: HMAC-SHA256On-call management and incident response with native event mapping for triggered, acknowledged, and resolved events.
ServiceNow
Authentication: API KeyEnterprise IT service management with CMDB CI mapping for infrastructure context.
Monitoring & observability
Datadog
Authentication: Bearer TokenFull-stack monitoring with metrics, alerts, and tag-based service correlation.
Grafana
Authentication: Bearer TokenAlert notifications with dashboard links, panel context, and common labels extraction.
Prometheus / Alertmanager
Authentication: Bearer TokenNative Alertmanager webhook receiver with label extraction, grouping support, and Kubernetes metadata.
Cloud provider alerting
AWS CloudWatch
Authentication: API KeyEventBridge-based alerting with alarm state, metric data, and namespace context.
APM & error tracking
New Relic
Authentication: API KeyFull-stack observability with issue priorities and entity context.
Dynatrace
Authentication: API KeySoftware intelligence with problem impact analysis and AI-detected root causes.
Custom integration
Platform Roadmap: Don’t see your platform listed? Use the Generic Webhook for immediate integration, or contact support to request a native connector for your monitoring tool.
Setting up a webhook integration
The setup wizard guides you through platform selection, webhook configuration, and automatic root cause analysis settings.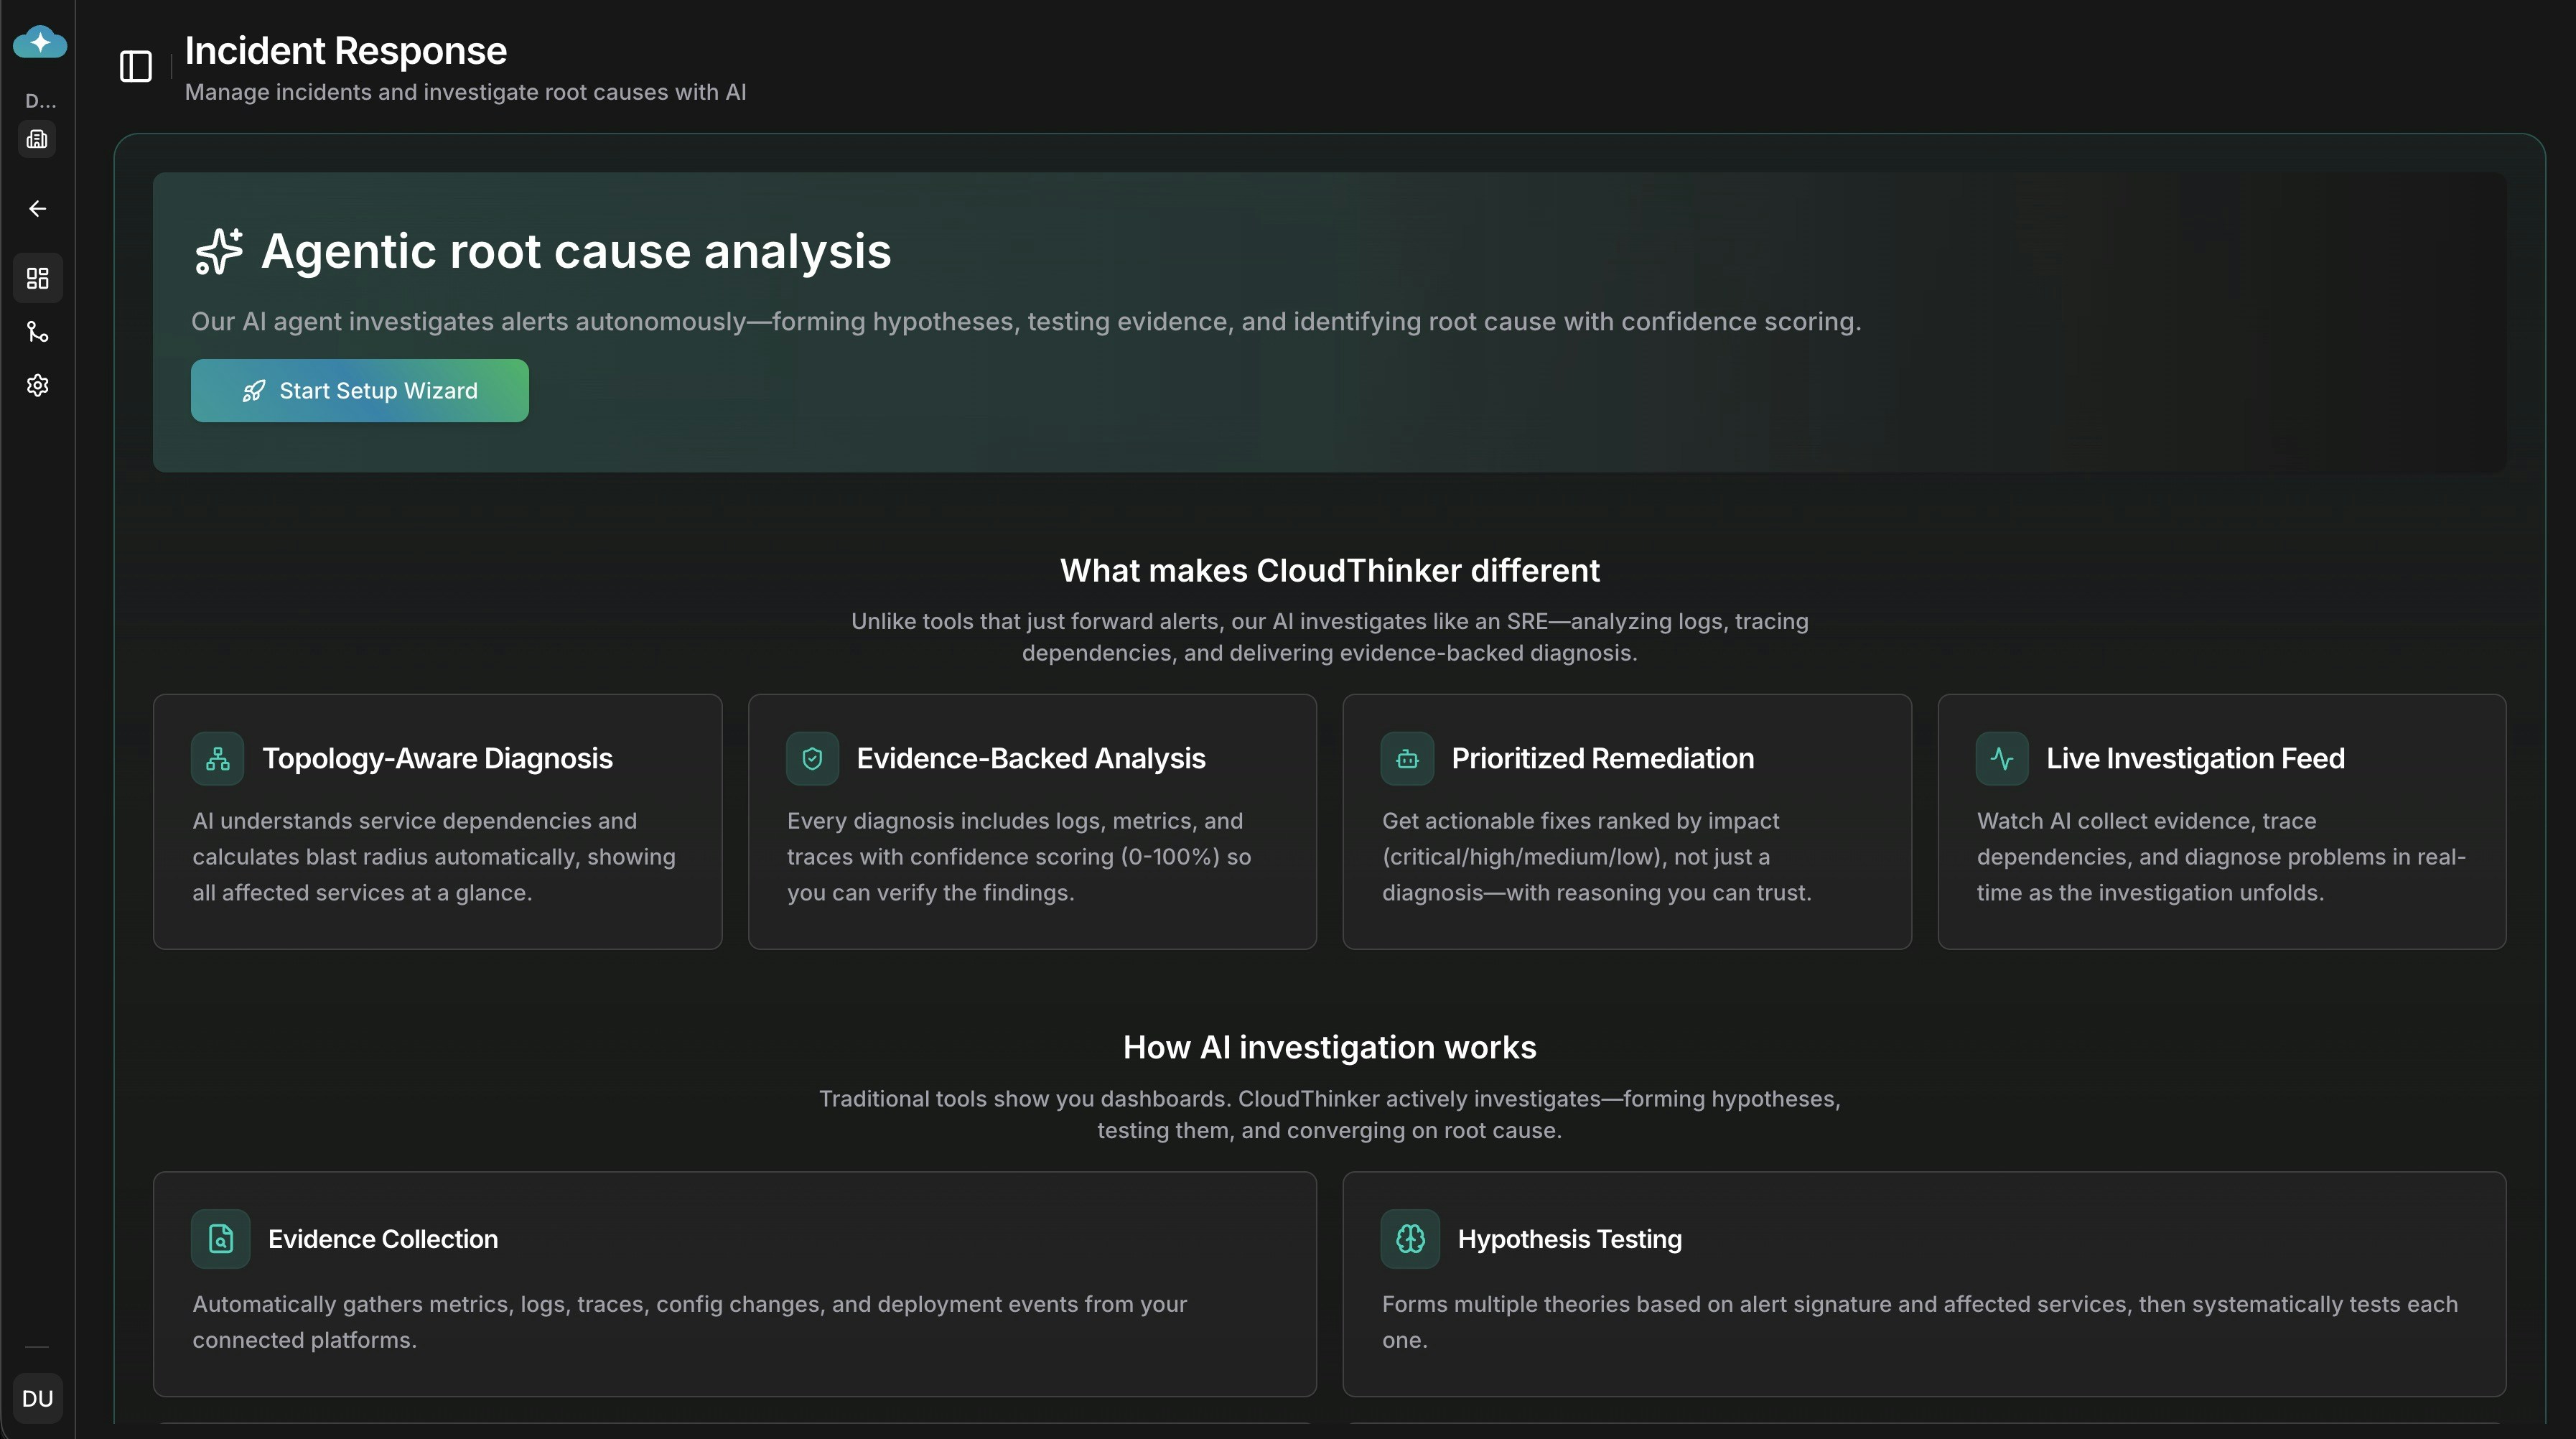
Deep Response Engine dashboard with setup wizard entry point
1
Navigate to Integrations
Go to Deep Response Engine → Settings → Integrations tab to access webhook management.
2
Create Webhook
Click Connect on your platform card. The creation wizard opens with platform-specific defaults pre-configured.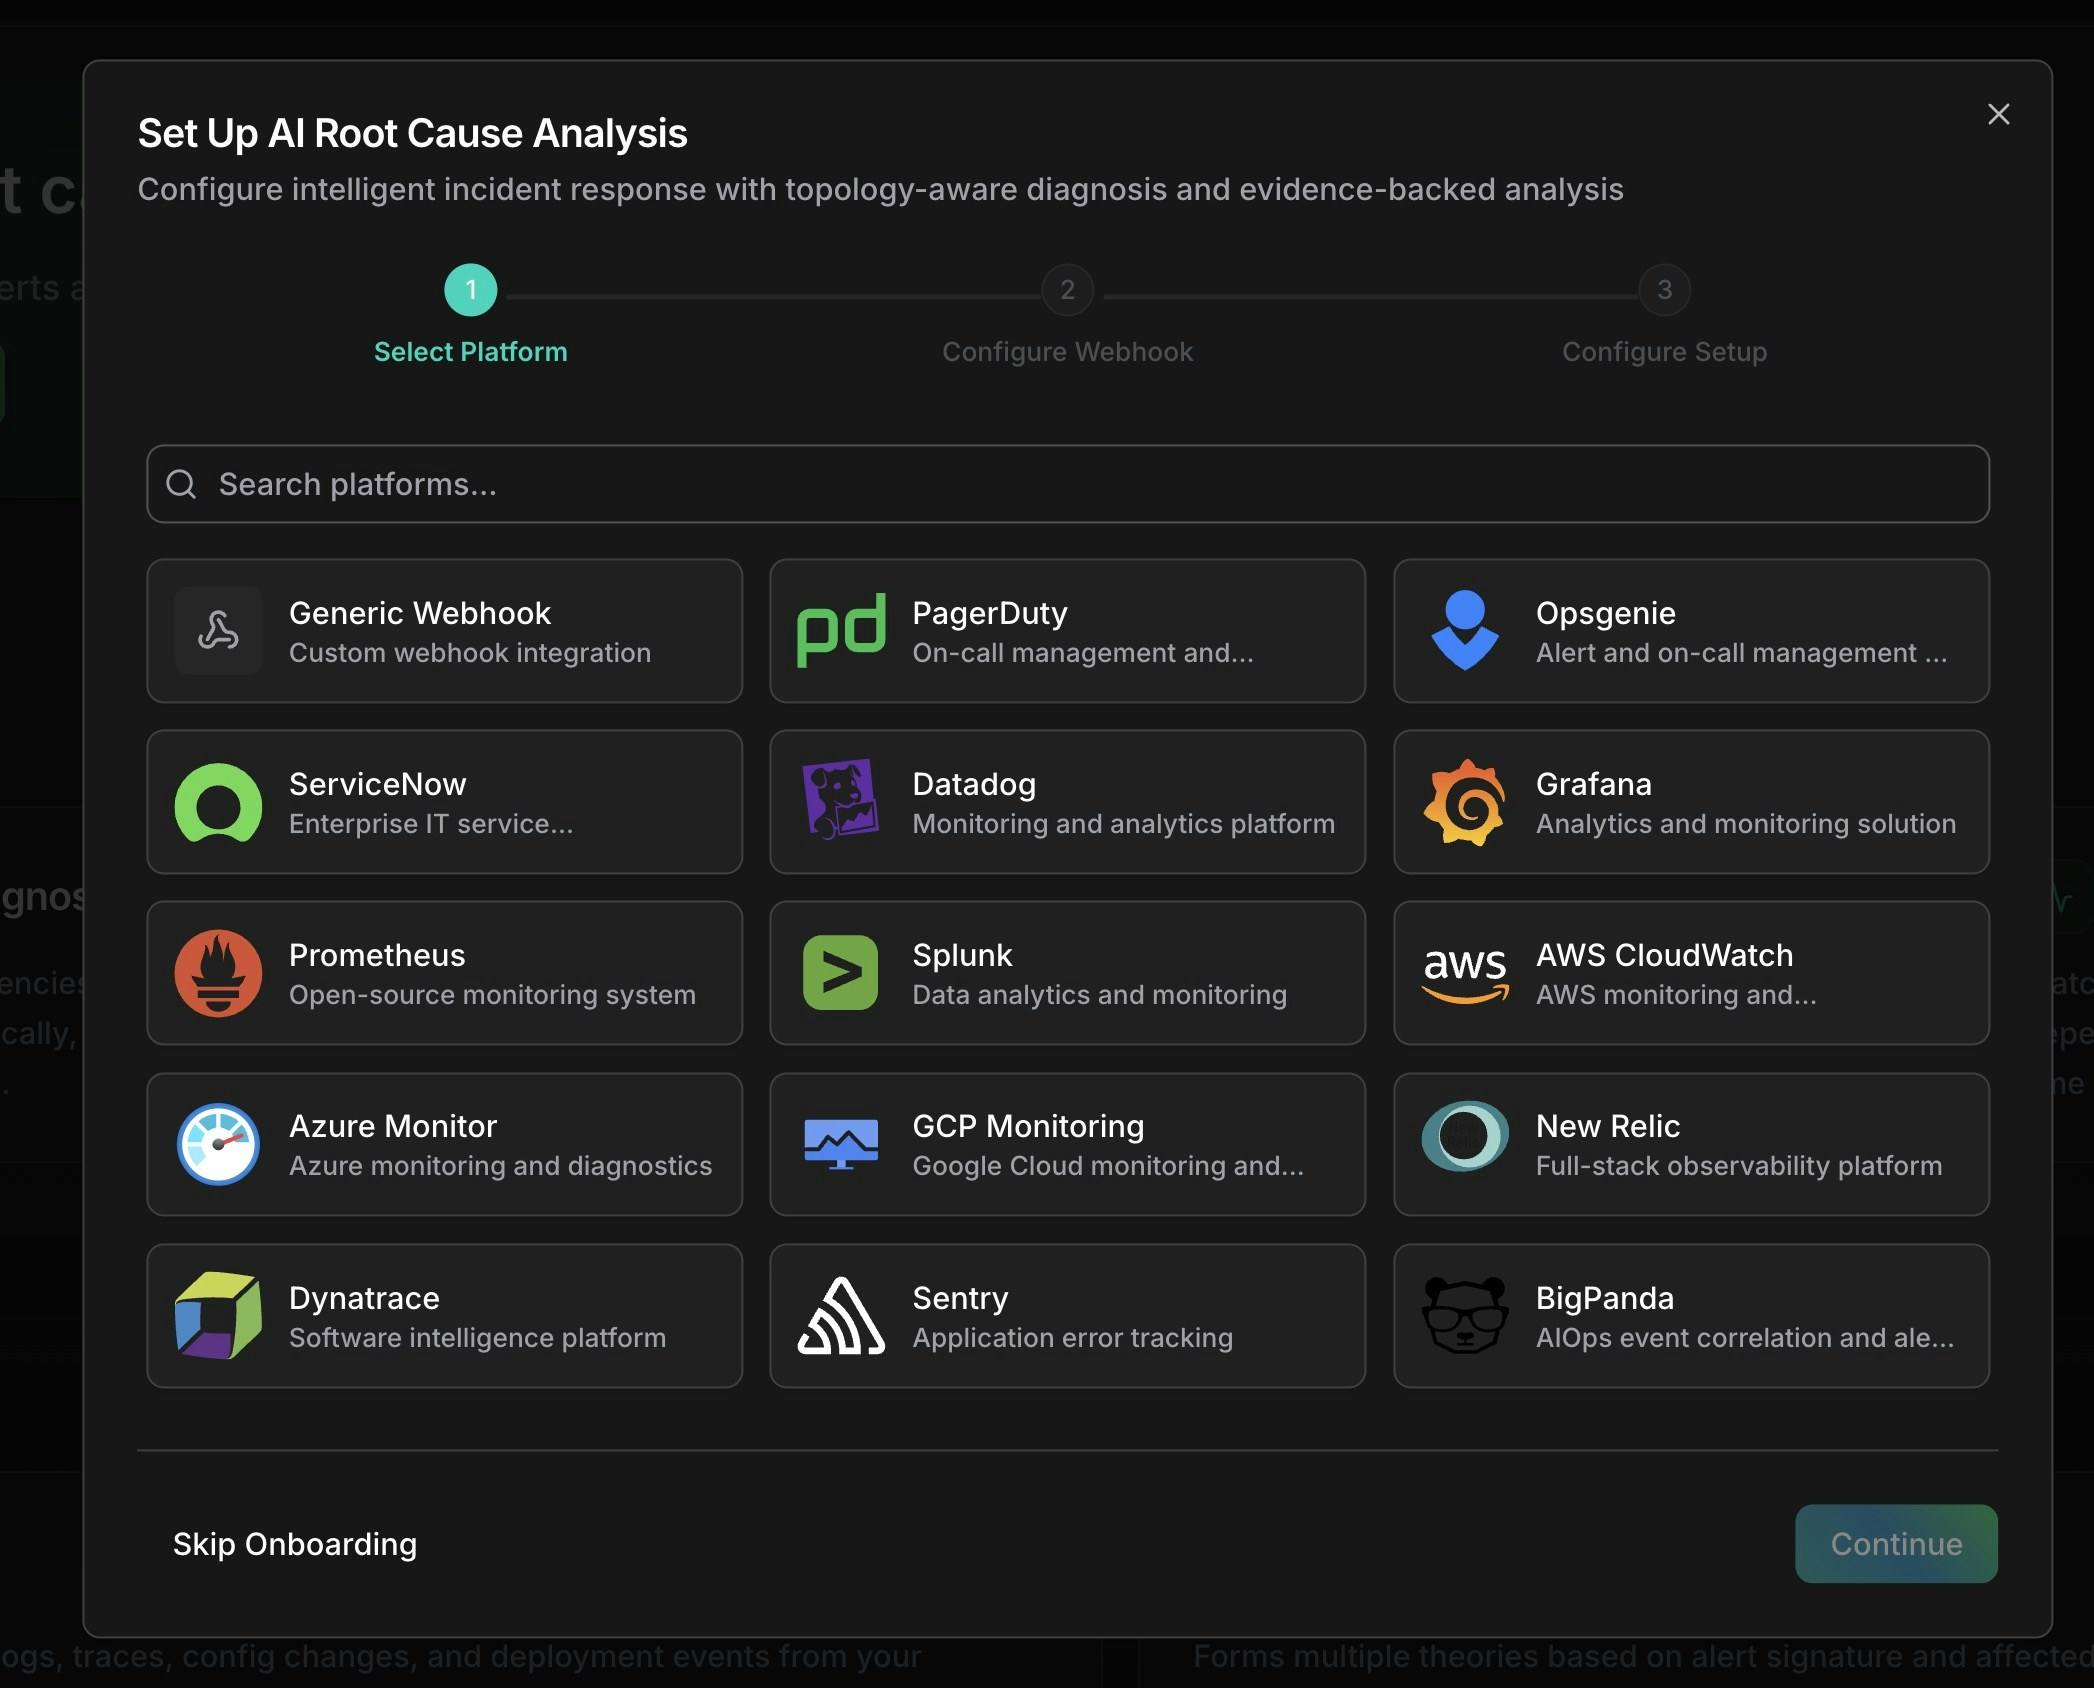
Select your monitoring platform from the available options
3
Configure Basic Info
Enter a name and optional description for your webhook. Set a rate limit if needed (default: 100 requests per hour).
4
Review Field Mapping
Each platform has pre-configured JSONPath mappings that extract incident fields from your webhook payload. Customize if needed: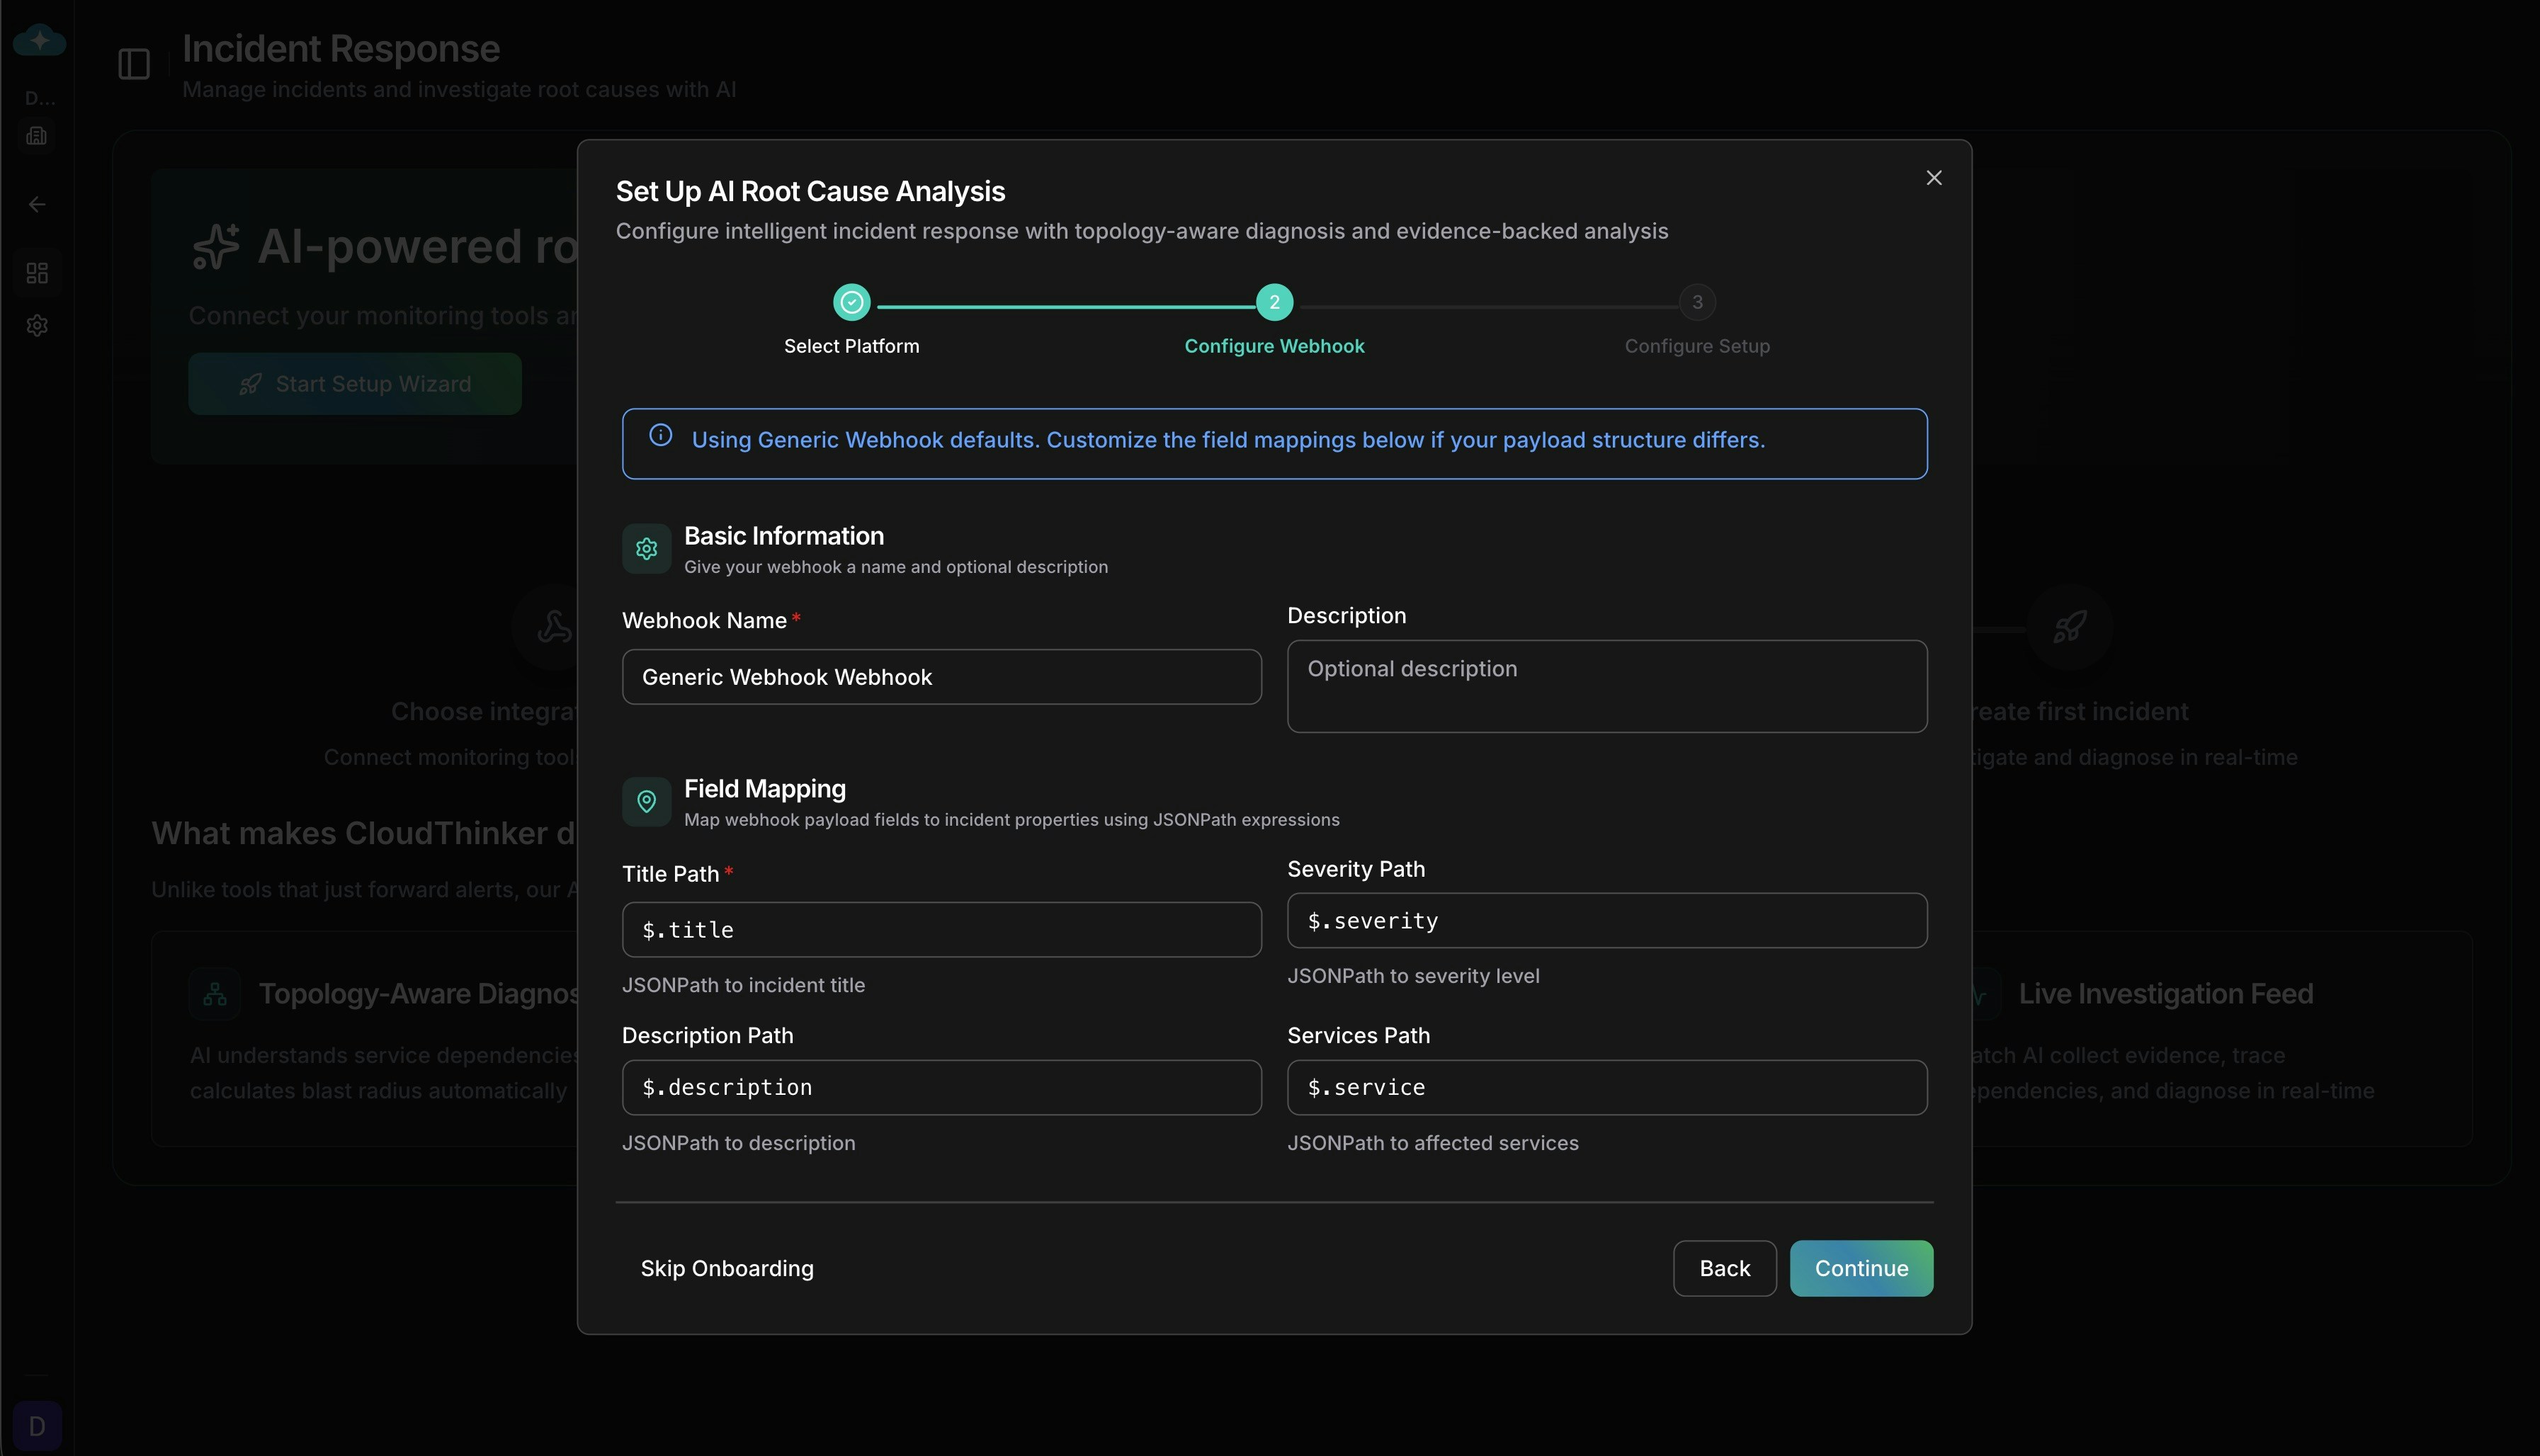
You can also configure severity mapping to translate your platform’s severity values (e.g.,
warning → medium, P1 → critical) to CloudThinker’s severity levels.Configure JSONPath field mappings for your webhook payload
5
Configure Auto-Trigger Settings
Control how incidents trigger Root Cause Analysis: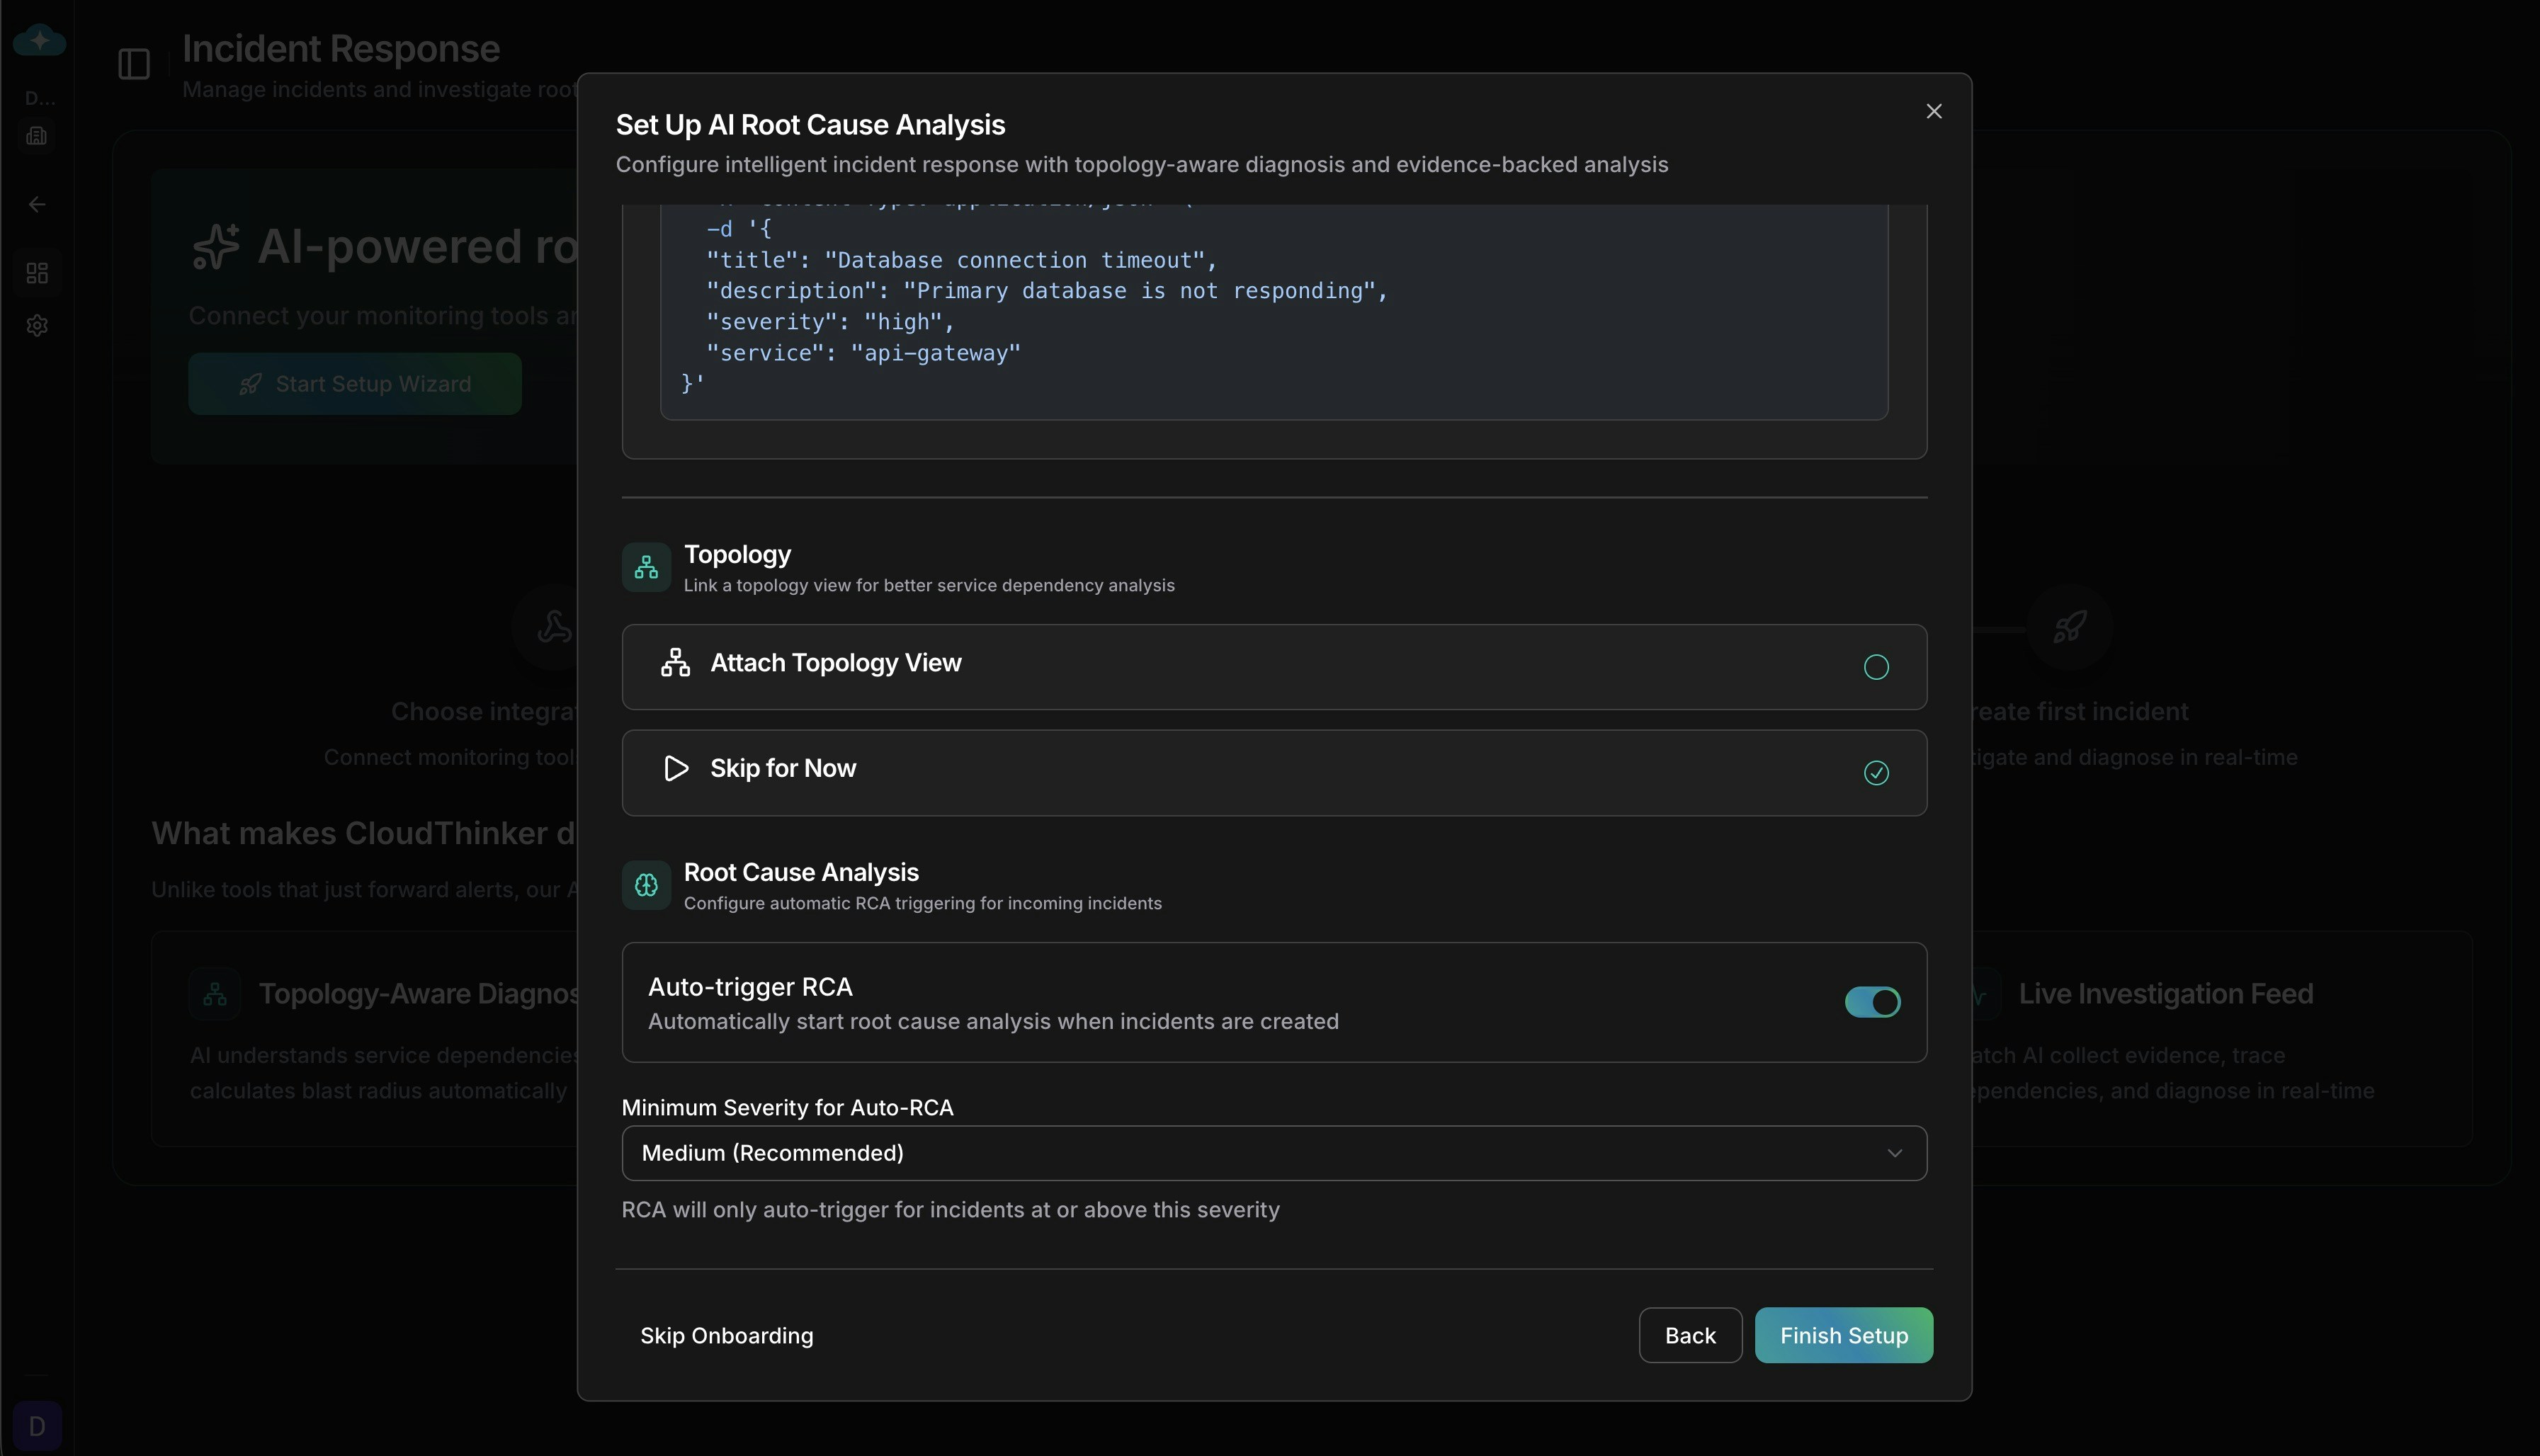
- Auto-trigger RCA: Automatically start AI investigation when an incident is created
- Minimum severity: Only trigger RCA for incidents at this severity level or higher (default: Medium)
- Send all fields to agent: Forward the complete webhook payload to the RCA agent for richer analysis
Configure automatic RCA triggering and severity thresholds
6
Copy Webhook URL & Authentication
The Setup tab displays your webhook URL and authentication details. Copy these credentials and configure them in your alerting platform.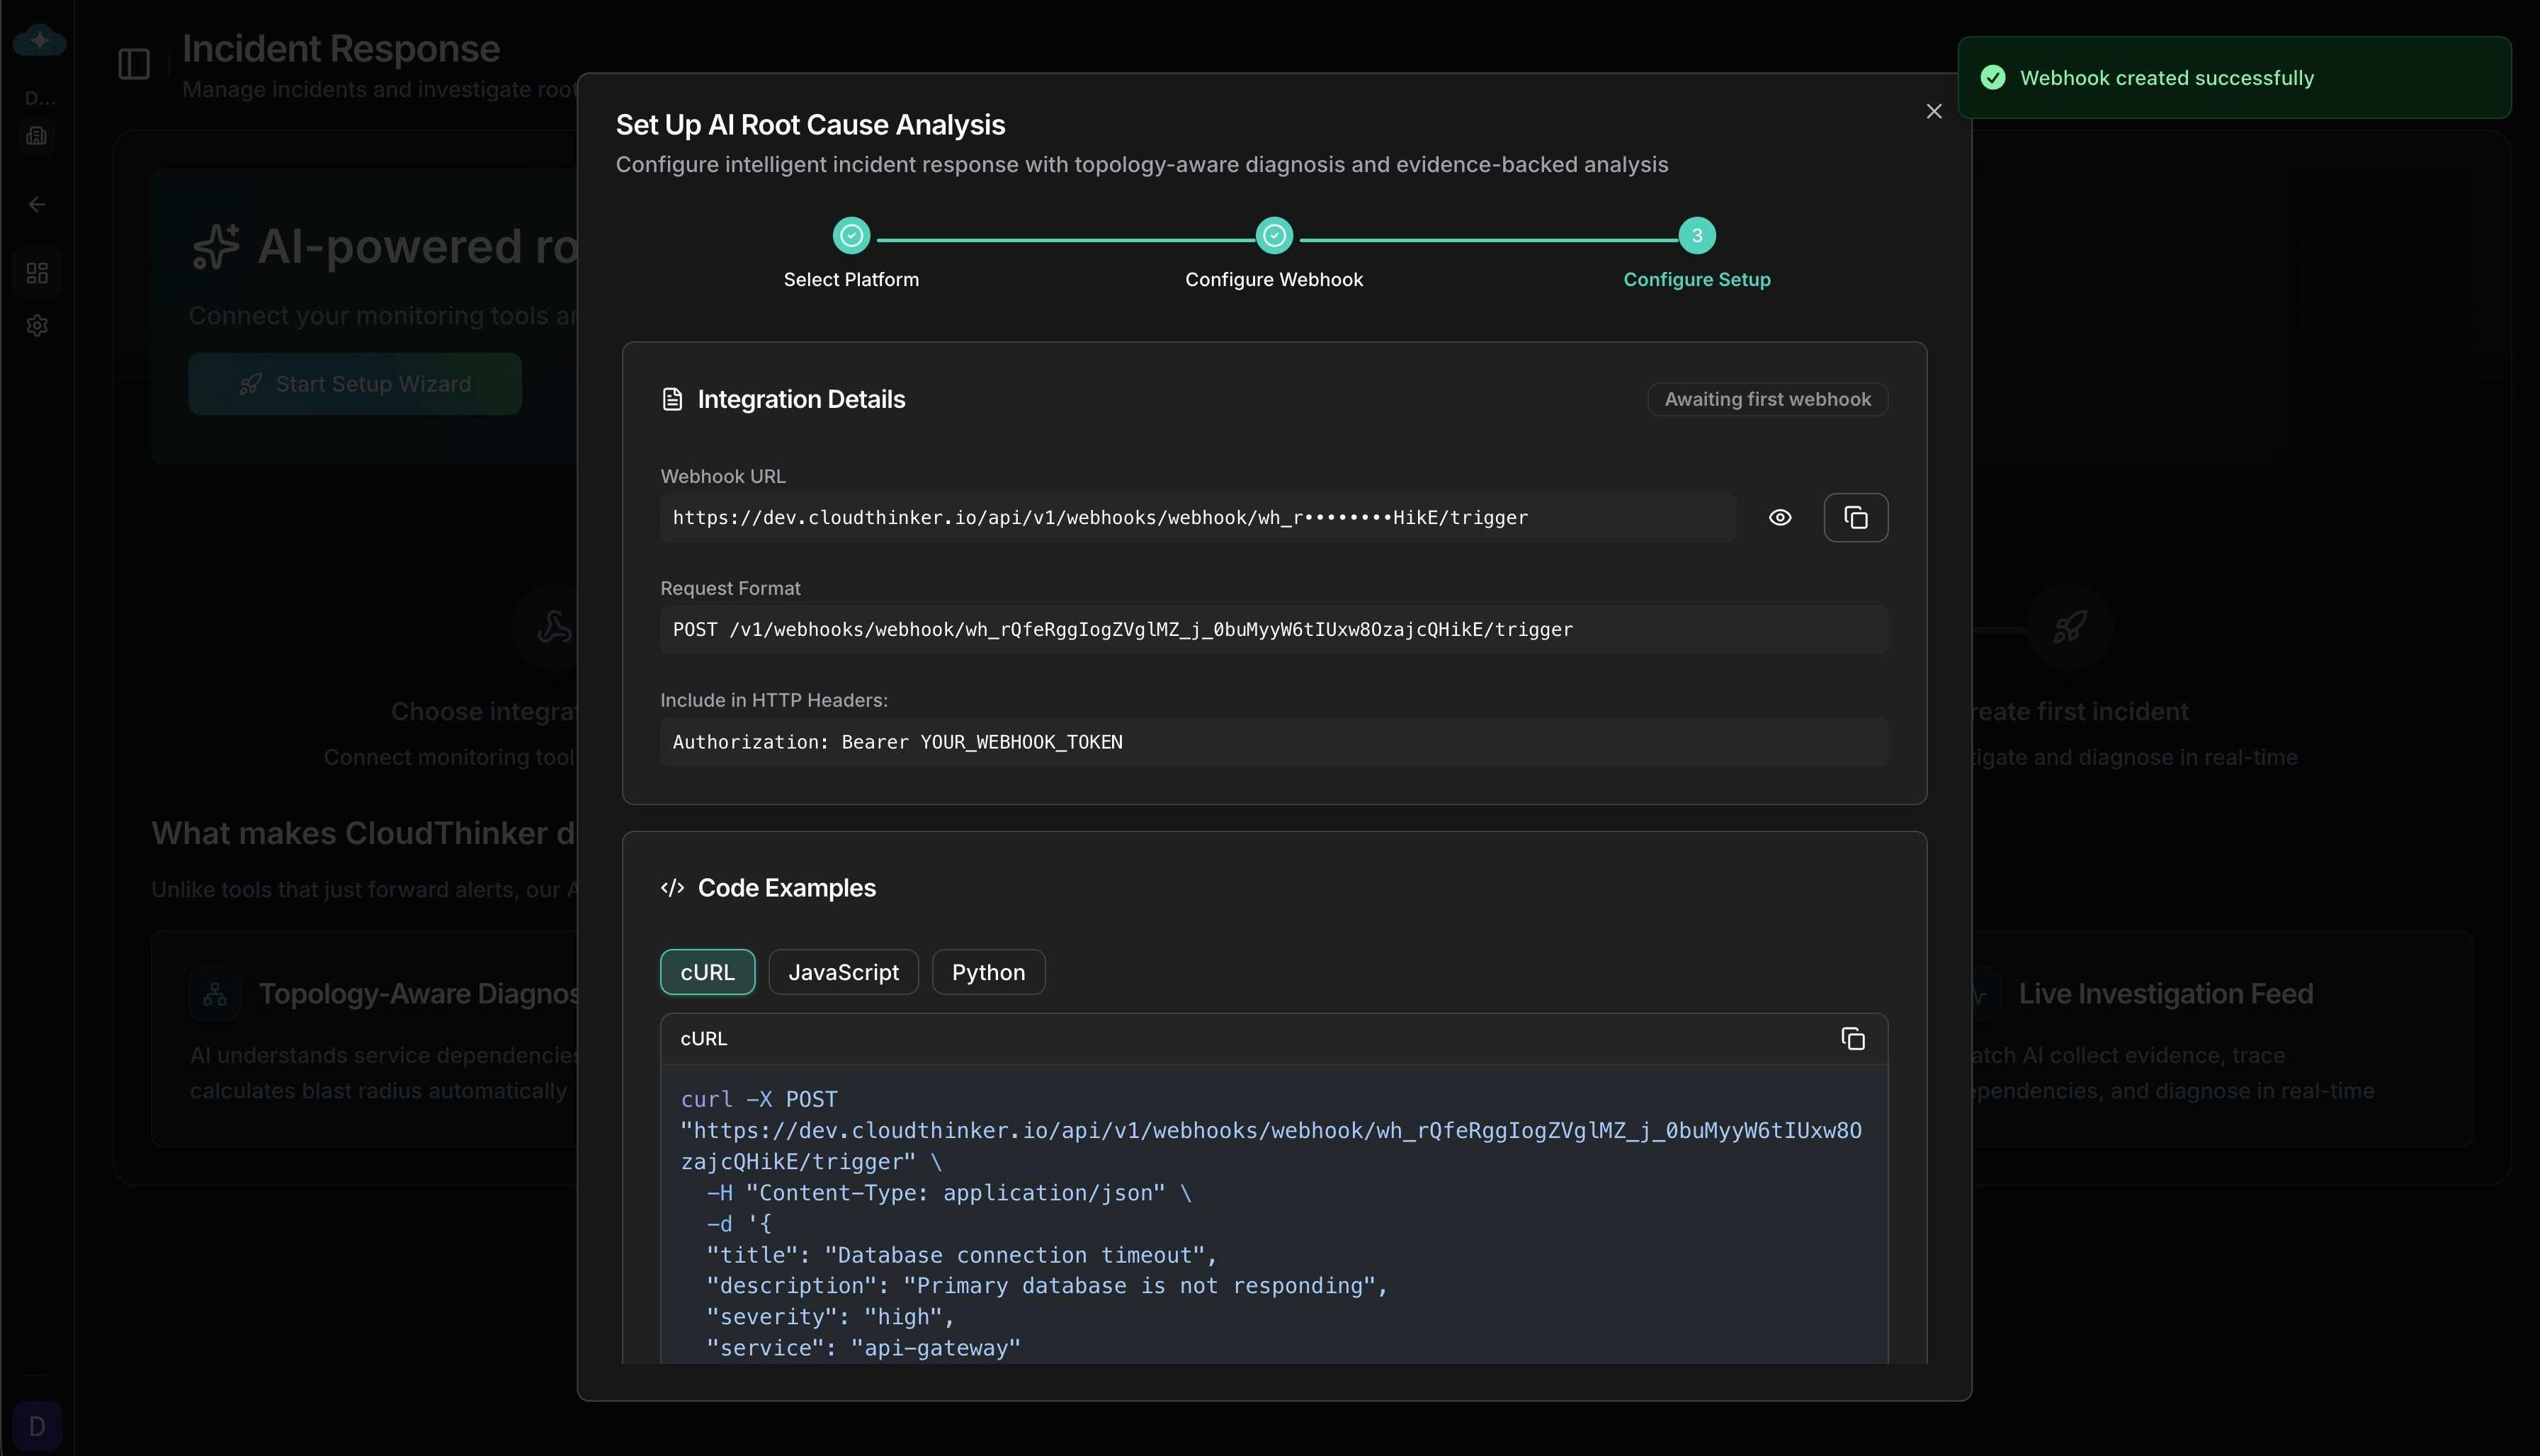
Copy your webhook URL and authentication headers to configure in your alerting platform
Authentication methods
CloudThinker supports four authentication methods to match your platform’s requirements. The correct method is pre-selected when you choose a platform, but you can change it for custom integrations.When you change the authentication method on an existing webhook, existing integrations using the previous method will immediately stop working. Regenerate credentials after changing auth methods.
Alert correlation
When multiple alerts arrive within a short time window, CloudThinker can automatically correlate them into a single incident instead of creating duplicates. This reduces alert fatigue from cascading failures.Time window correlation
Groups alerts received within a configurable window (default: 5 minutes). When a new alert matches an existing open incident, it’s attached as a correlated alert rather than creating a new incident.Rule-based correlation
Define custom rules to match incoming alerts against existing incidents based on shared attributes. Rules are configured from the webhook card menu under Correlation Rules. Each rule specifies:- Conditions with AND/OR logic for matching
- Priority (0-1000) to control evaluation order
- Weight (0.0-1.0) to indicate match confidence
- Minimum match weight threshold to accept a correlation
Security & limits
Payload limits
Rate limiting
Rate limits are configurable per webhook. Set to 0 for unlimited.
Security features
- Timing-safe signature verification prevents timing attacks on HMAC validation
- Encrypted secret storage — webhook secrets are encrypted at rest
- Credential rotation — regenerate webhook tokens and secrets without recreating the webhook
- Payload sanitization — oversized fields are automatically truncated
- Sensitive header filtering — authentication headers are excluded from audit logs
Related
AWS CloudWatch
Step-by-step guide for routing CloudWatch alarms via Amazon EventBridge.
Root cause analysis
Configure automatic AI-powered investigation triggered by incoming webhooks.