How Existing Incident Tools Compare
Detection and alerting are solved. Investigation and resolution are not.| Tool | What It Does | What’s Missing |
|---|---|---|
| PagerDuty / Opsgenie | Routes alerts to on-call engineers | Routing only — you still investigate manually after being paged |
| VictorOps / Splunk On-Call | Alert routing + basic runbooks | Runbooks require manual triggering and expert interpretation |
| Blameless / Rootly / FireHydrant | Incident workflows and post-mortems | Process coordination, not real-time investigation |
| Datadog Watchdog / New Relic AIOps | Anomaly detection and alert correlation | Surfaces related alerts, but does not form hypotheses or investigate |
| AWS CloudWatch Alarms | Threshold-based alerting | Fires alerts, no investigation capability |
What Makes This Different
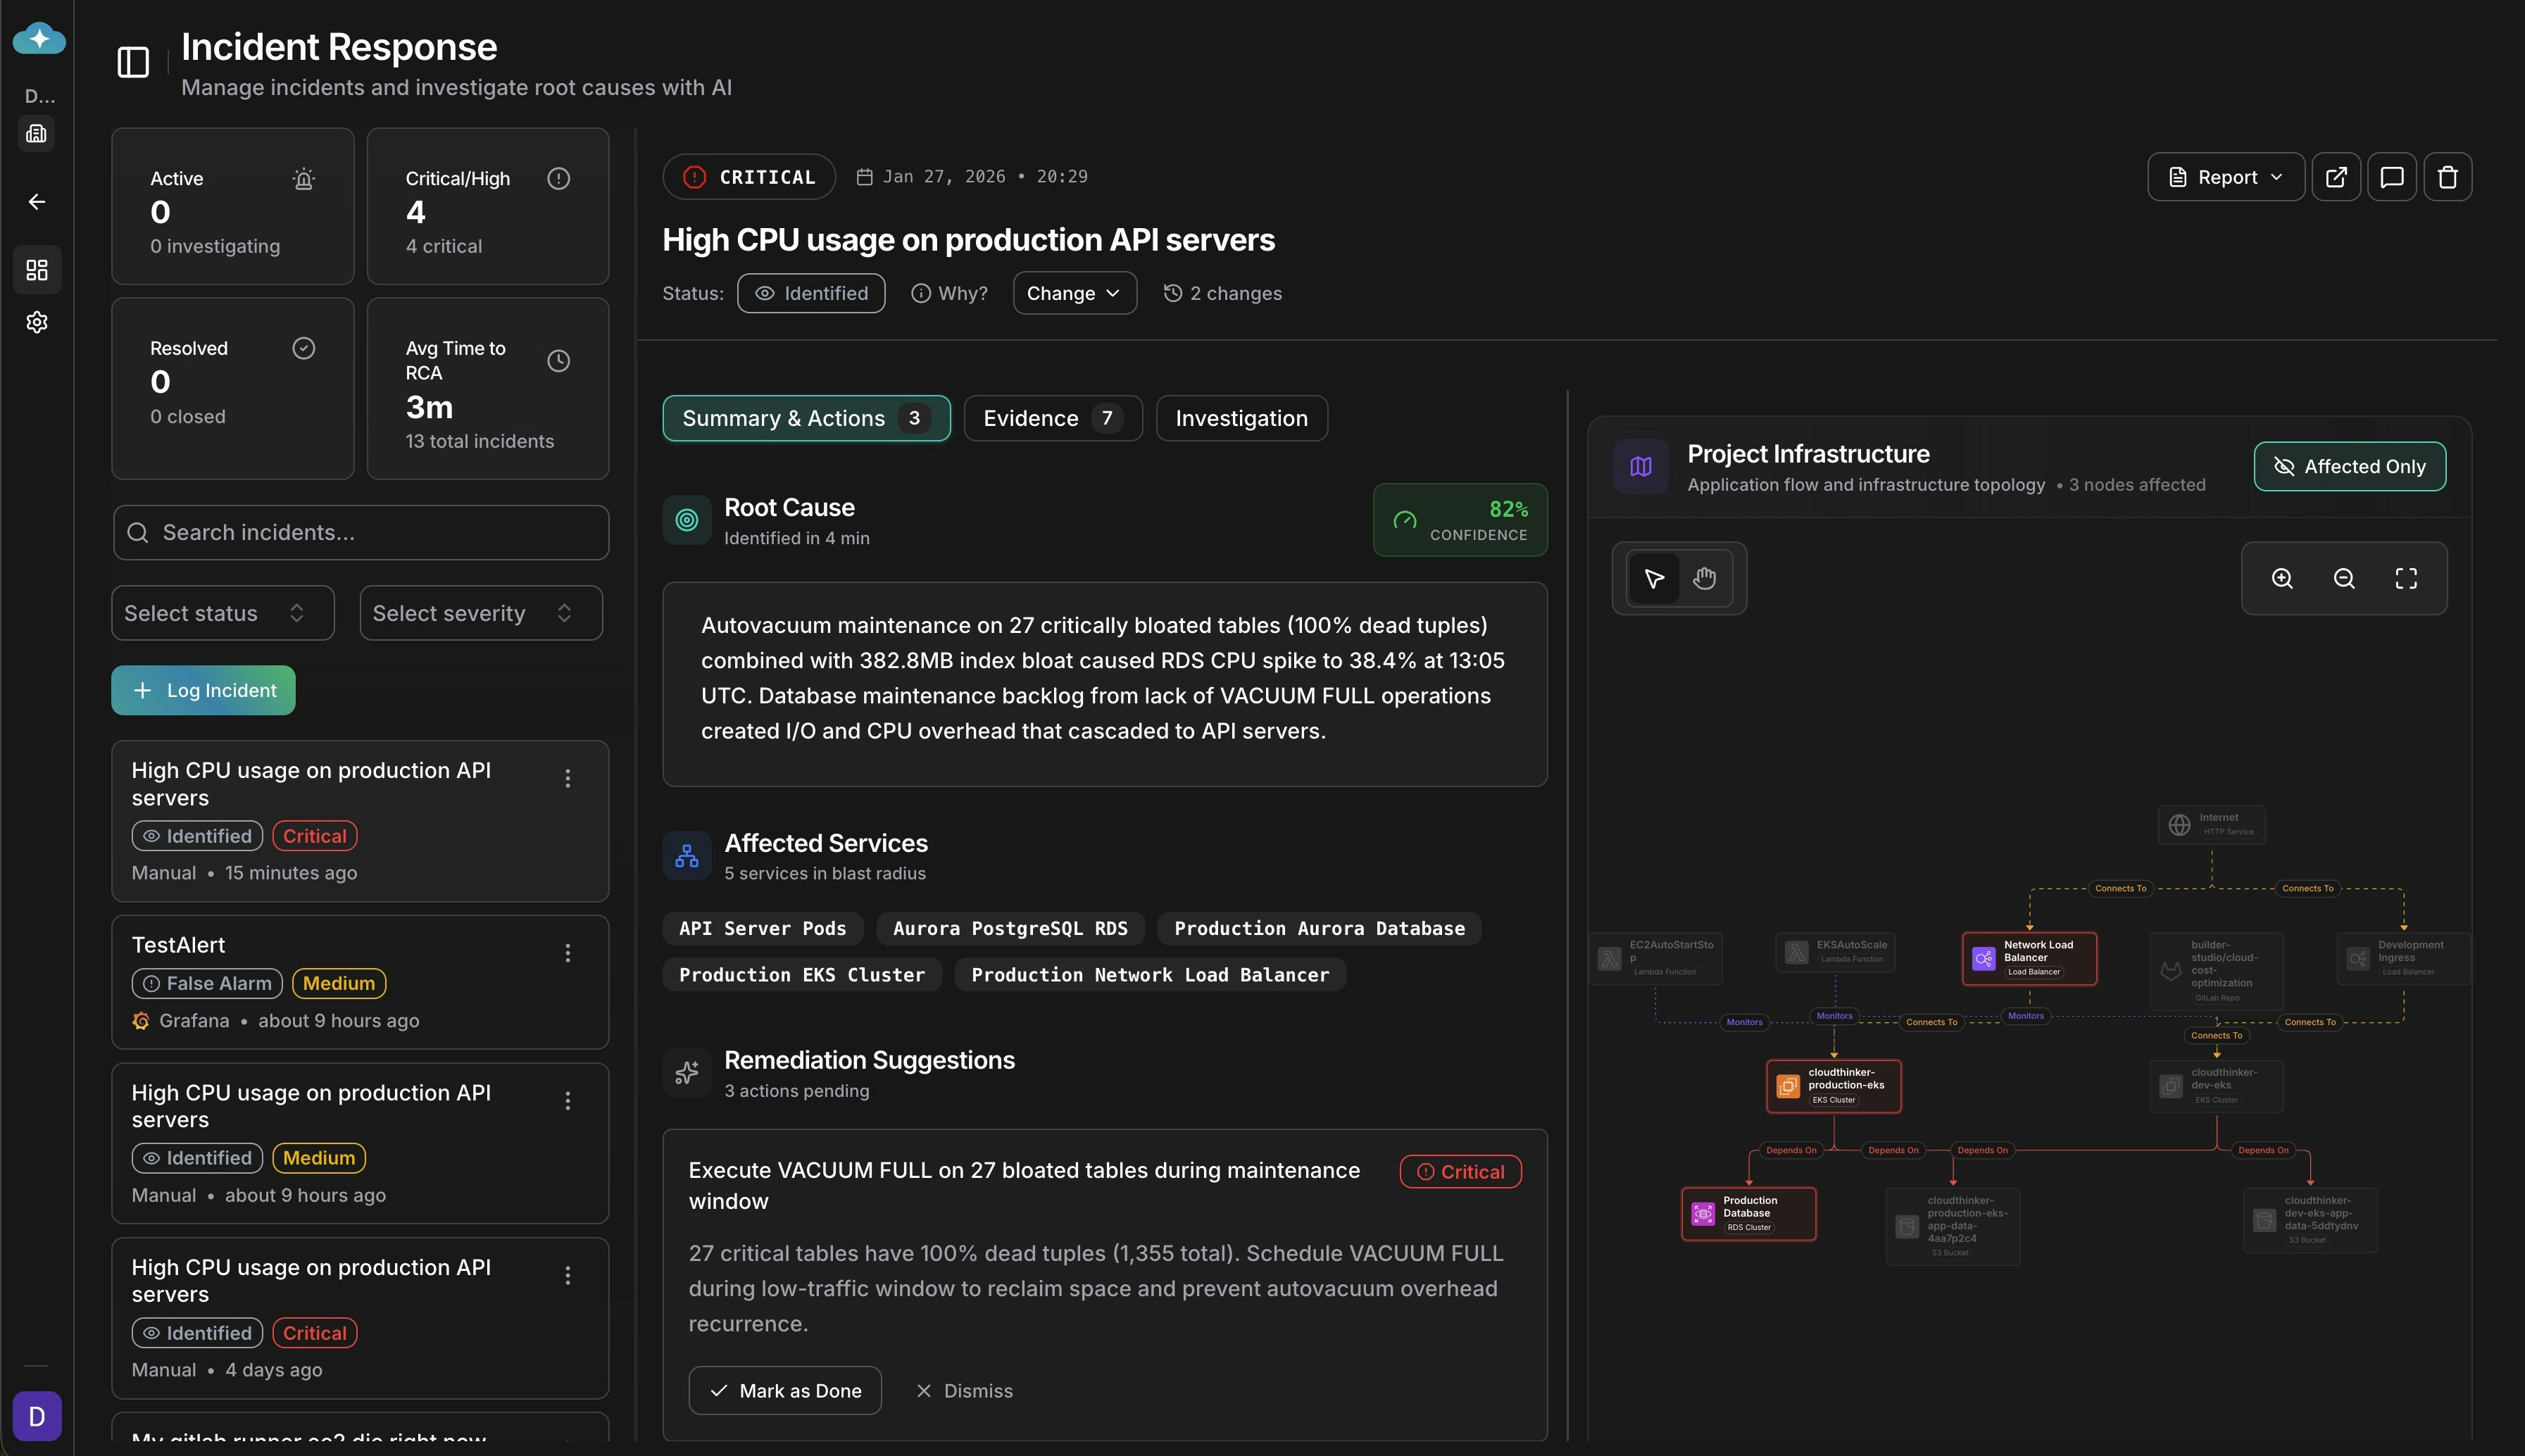
Hypothesis-driven investigation: The AI doesn’t just correlate events — it forms explicit theories (“memory leak in auth service”, “connection pool exhausted”, “recent deployment regression”) and tests each one systematically. Transparent reasoning: Every step of the investigation is visible. You can see which hypothesis was confirmed, which was ruled out, and why. No black box. Topology-aware blast radius: CloudThinker understands your service dependency graph. When the auth service fails, it knows payment breaks, which breaks checkout — and it maps the full impact before you ask. MTTR under 5 minutes: By the time an on-call engineer opens their laptop, the AI has already completed the investigation, ranked the most likely root causes, and suggested remediation steps.
CloudThinker Incidents dashboard showing AI-powered root cause analysis in action
AI That Investigates
CloudThinker Incidents is AI-native. The AI isn’t a chatbot bolted onto an existing product—it’s the foundation of how incidents are analyzed and resolved.Hypothesis-Driven Investigation
The AI forms theories about what went wrong and systematically tests each one against your data, tracking which hypotheses are confirmed or ruled out.
Transparent Reasoning
Every step is visible in real-time. See what the AI checked, what it found, and the path it took to reach its conclusion. No black box.
Structured Evidence
Metrics with before/after comparisons, logs with timestamps, deployment changes with time-to-incident calculations—all organized into a coherent chain.
Confidence Scoring
Not every investigation reaches certainty. Confidence scores tell you whether you’re looking at a definitive answer or a hypothesis that needs verification.
How It Works
Incident Created
An incident is created manually, via API, or automatically when webhook alerts arrive from your monitoring tools.
Investigation Begins
An AI agent immediately starts investigating—no waiting, no manual trigger required.
Hypotheses Tested
The agent forms theories (“memory leak in auth service”, “recent deployment regression”, “exhausted connection pool”) and tests each one.
Evidence Gathered
Metrics, logs, traces, configurations, and deployments are collected and organized with timeline correlation.
Root Cause Identified
The AI identifies the root cause with confidence scoring and transparent reasoning you can verify.
Topology Awareness
Your services don’t exist in isolation. When your auth service fails, everything downstream fails too—checkout breaks, mobile apps throw errors, and support tickets spike across seemingly unrelated features. CloudThinker understands your infrastructure topology. When an incident occurs, the AI automatically:- Identifies affected services using your service dependency map
- Calculates blast radius showing what’s broken and what’s impacted
- Investigates with context knowing that payment depends on auth, which depends on Redis, which runs on a specific cluster
Connect Everything You Already Use
CloudThinker integrates with the monitoring tools your team already relies on. We support webhooks from 15+ platforms:| Platform | What’s Supported |
|---|---|
| PagerDuty | Native field mapping for alert details and priorities |
| Datadog | Metrics, alerts, and event correlation |
| Prometheus / Alertmanager | Kubernetes-native monitoring |
| AWS CloudWatch | Native support for AWS infrastructure alerts |
| Opsgenie | Priority and description extraction |
| New Relic, Grafana, Splunk, Dynatrace, Sentry | And more |
Continuous Learning
Every incident is an opportunity to get better. CloudThinker’s agent knowledge base system captures investigation patterns so the AI improves over time. When the agent discovers that a particular metric query is useful for diagnosing memory issues, or that a specific log pattern indicates a connection pool problem, those techniques become part of its toolkit. Your team’s operational knowledge—the hard-won insights from years of debugging production systems—gets preserved and applied automatically.Next Steps
Ready to start investigating incidents? Set up incident ingestion from your monitoring tools:Webhook Integrations
Connect your monitoring platforms to auto-create incidents. Configure field mappings for PagerDuty, Datadog, Prometheus, CloudWatch, and 10+ more platforms.
Root Cause Analysis
Understand hypothesis-driven investigation and confidence scoring
Webhook Integrations
Connect PagerDuty, Datadog, Prometheus, CloudWatch, and 11 more platforms
Topology
Map service dependencies to enable blast radius analysis during incidents
Slack Integration
Run incident investigation commands directly from Slack