AWS Polling
AWS polling lets Pulse pull events directly from your AWS accounts on a schedule — no webhook configuration required. Each source is enabled per-connection.| Source | What Pulse Collects | Cadence |
|---|---|---|
| CloudTrail | API call audit logs — who did what, when, on which resource | Every 5 min |
| AWS Health | Service health events impacting your account or region | Every 5 min |
| Cost Anomaly | Spend spikes detected by AWS Cost Anomaly Detector | Every 6 hours |
| GuardDuty | Threat intelligence findings — compromised instances, suspicious behavior | Periodic |
| Config | Resource configuration drift against Config rules | Periodic |
| Access Analyzer | IAM and S3 access findings — overly permissive or public resources | Periodic |
Enabling a Poller
Open polling settings
In Pulse, click Manage subscriptions and navigate to the AWS Polling section. You’ll see your connected AWS accounts and their current polling status.
Validate first
Click Validate next to the source. Pulse performs a dry run to confirm your credentials have the required read permissions. A clear ✓ means ready; an error code (e.g.
AccessDenied) tells you exactly what’s missing.Auto-Pause
If a poller fails five consecutive times, Pulse pauses it automatically and surfaces the error code. To resume: fix the issue, re-validate, then re-enable the toggle.AWS polling requires an active AWS connection with read permissions for the relevant services.
Slack & Teams Subscriptions
When the CloudThinker bot is present in a channel, messages in that channel become Pulse signals — alert bot posts, incident announcements, on-call chatter — classified alongside your infrastructure events.Creating a Subscription
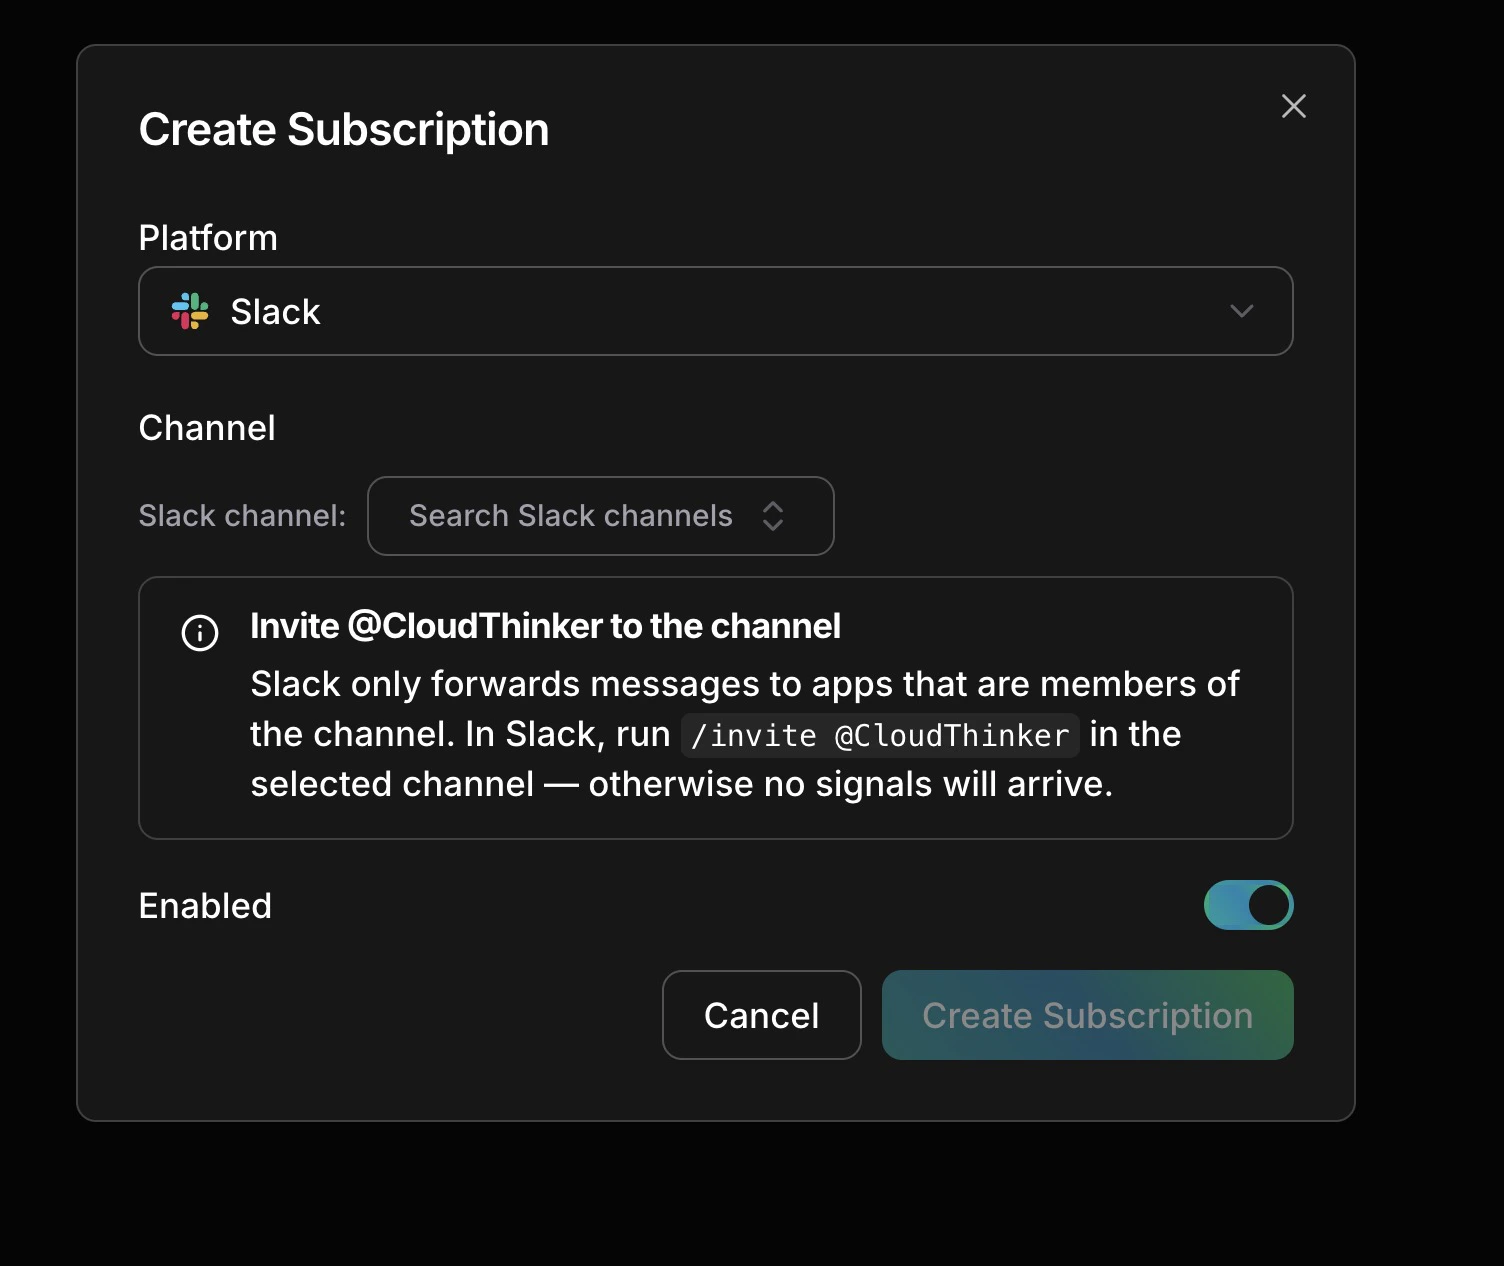
Select a platform, pick a channel, invite the bot, save
Invite the bot (Slack only)
Run
/invite @CloudThinker in the target channel — Slack only delivers messages to apps that are channel members.Channel Types
| Type | Best For |
|---|---|
| Alert | Channels used exclusively for automated alert bots |
| Communication | Channels used for human discussion — incident chats, handoffs |
| Mixed (default) | Channels with both automated alerts and human messages |
Third-Party Webhooks
Any monitoring tool that supports outbound webhooks can send signals to Pulse. The following platforms have built-in field mapping:Datadog
Monitors, alerts, anomaly detections
Grafana
Alert rule firings and annotations
New Relic
Incidents and NRQL alert results
PagerDuty
Incident and alert webhooks
Prometheus
Kubernetes alert rules
Sentry
Error events and performance alerts
Signal Categories
Every signal — regardless of source — is assigned one of eight categories:| Category | Examples |
|---|---|
| Compute | EC2 status, Lambda timeouts, ECS failures, container restarts |
| Network | NAT gateway anomalies, CloudFront degradation, VPC changes |
| Security | GuardDuty findings, IAM changes, S3 public access, WAF triggers |
| Cost | Cost anomalies, idle resources, Savings Plan drops, RI expiry |
| Data | RDS connection issues, S3 operations, database events |
| Deploy | CodeDeploy, ECS rollouts, CloudFormation stack changes |
| Communication | Slack and Teams messages, alert bot notifications |
| Unclassified | Default until the AI classifier assigns a category |