@alex #dashboard AWS spending by service for the last 30 days@oliver #report quarterly security assessment across all accounts@kai #dashboard cluster resource utilization
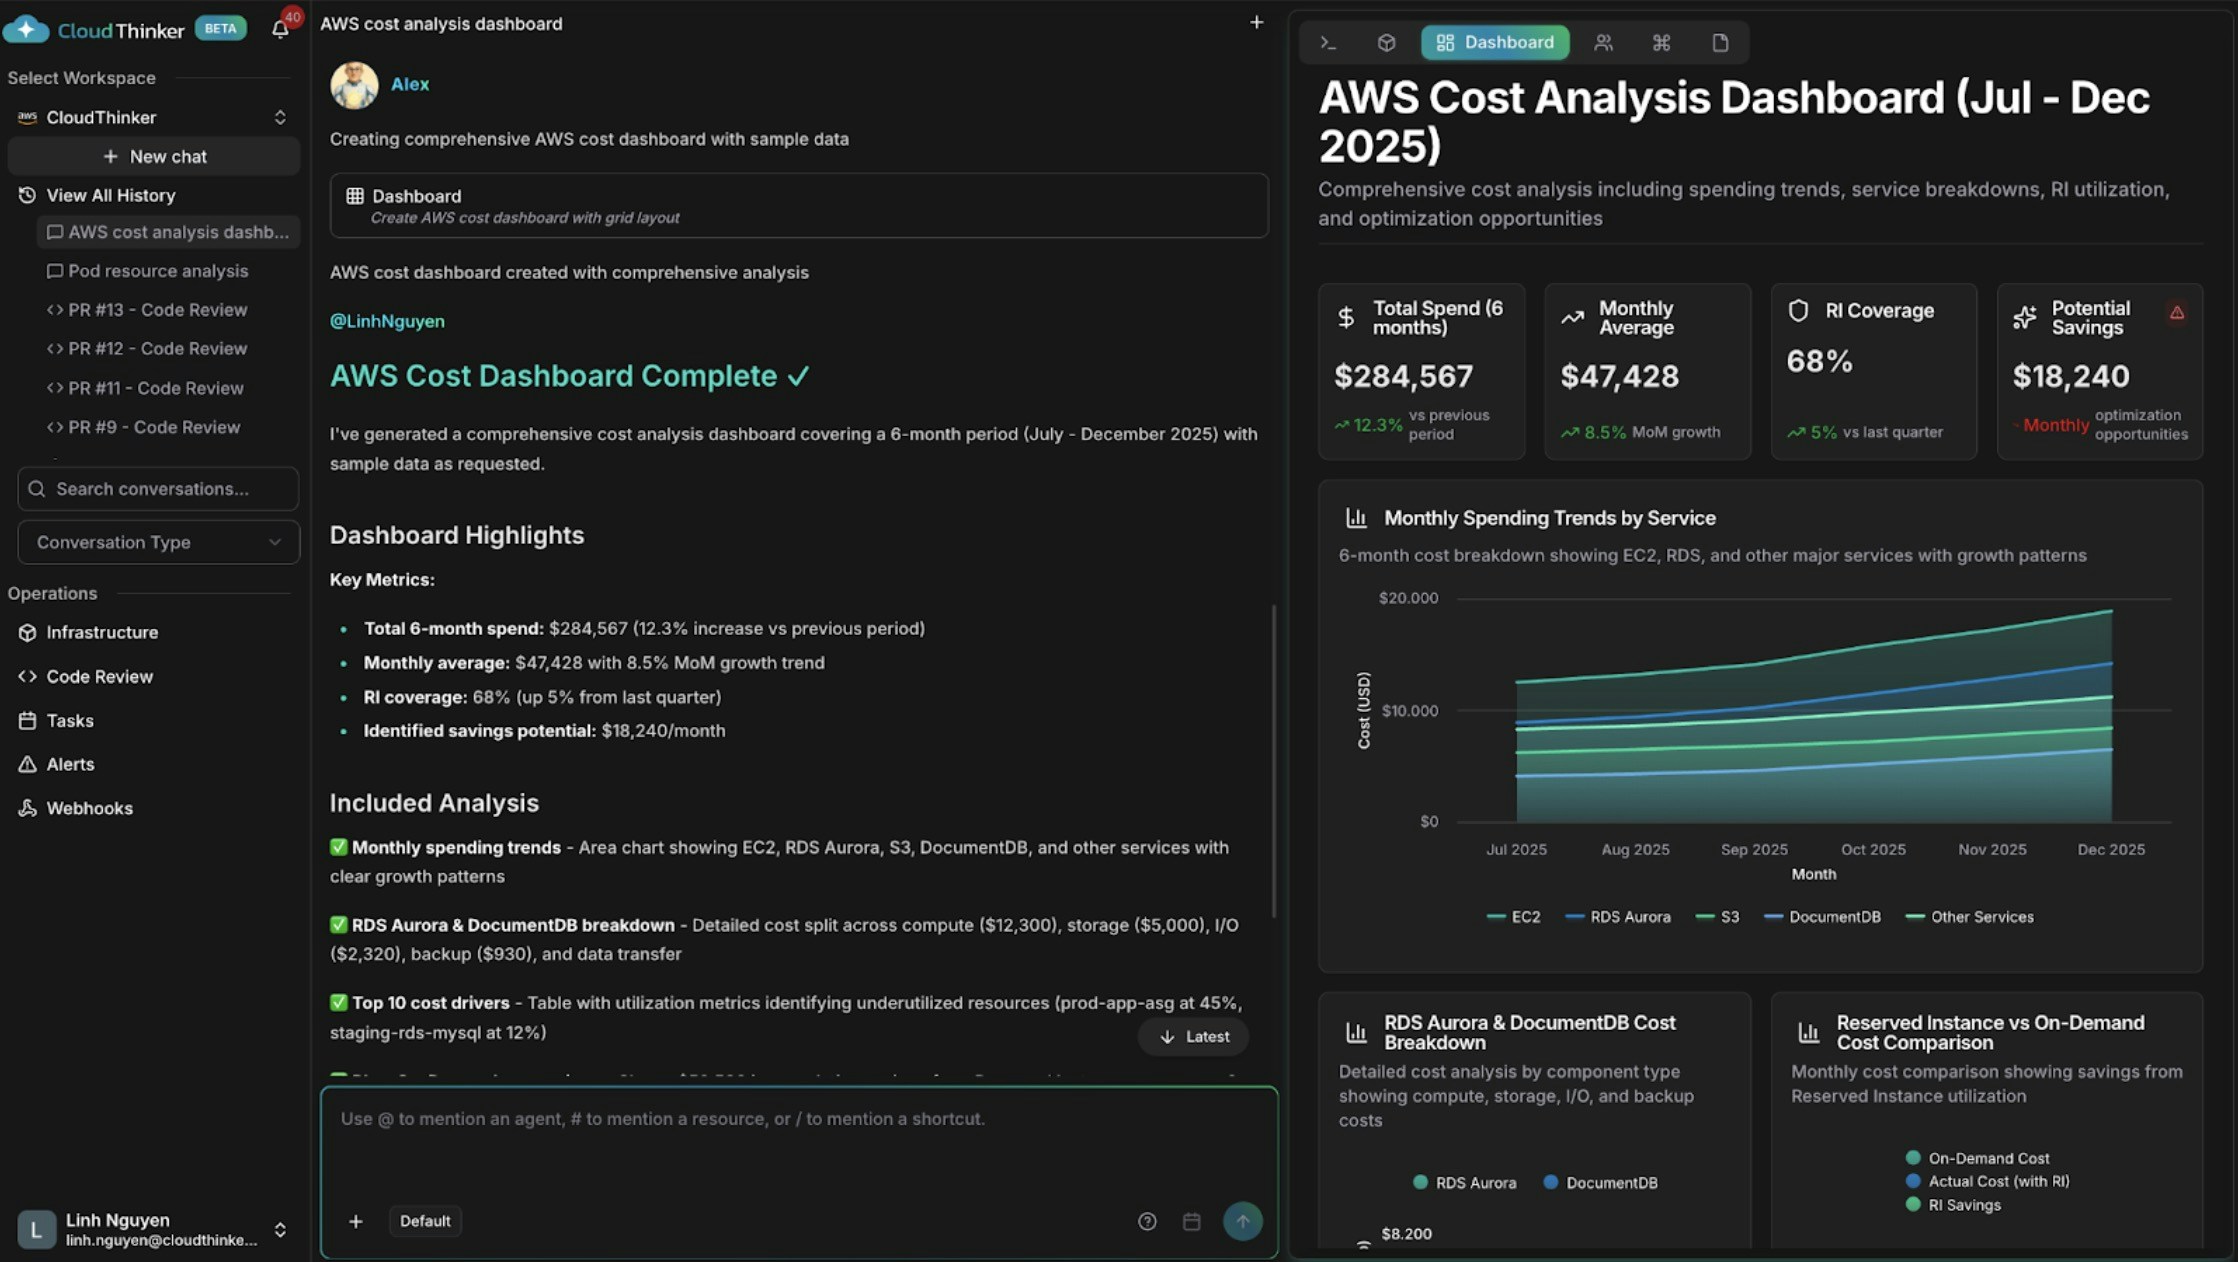
@alex #dashboard Generate a comprehensive AWS cost dashboard for [start_date] to [end_date].Include:- Monthly spending trends by service with month-over-month growth rates- Top 10 cost drivers and their utilization patterns- Reserved Instance vs On-Demand cost comparison- Cost anomalies and optimization opportunities with estimated savingsSegment by: [cost allocation tags such as environment, team, or application]
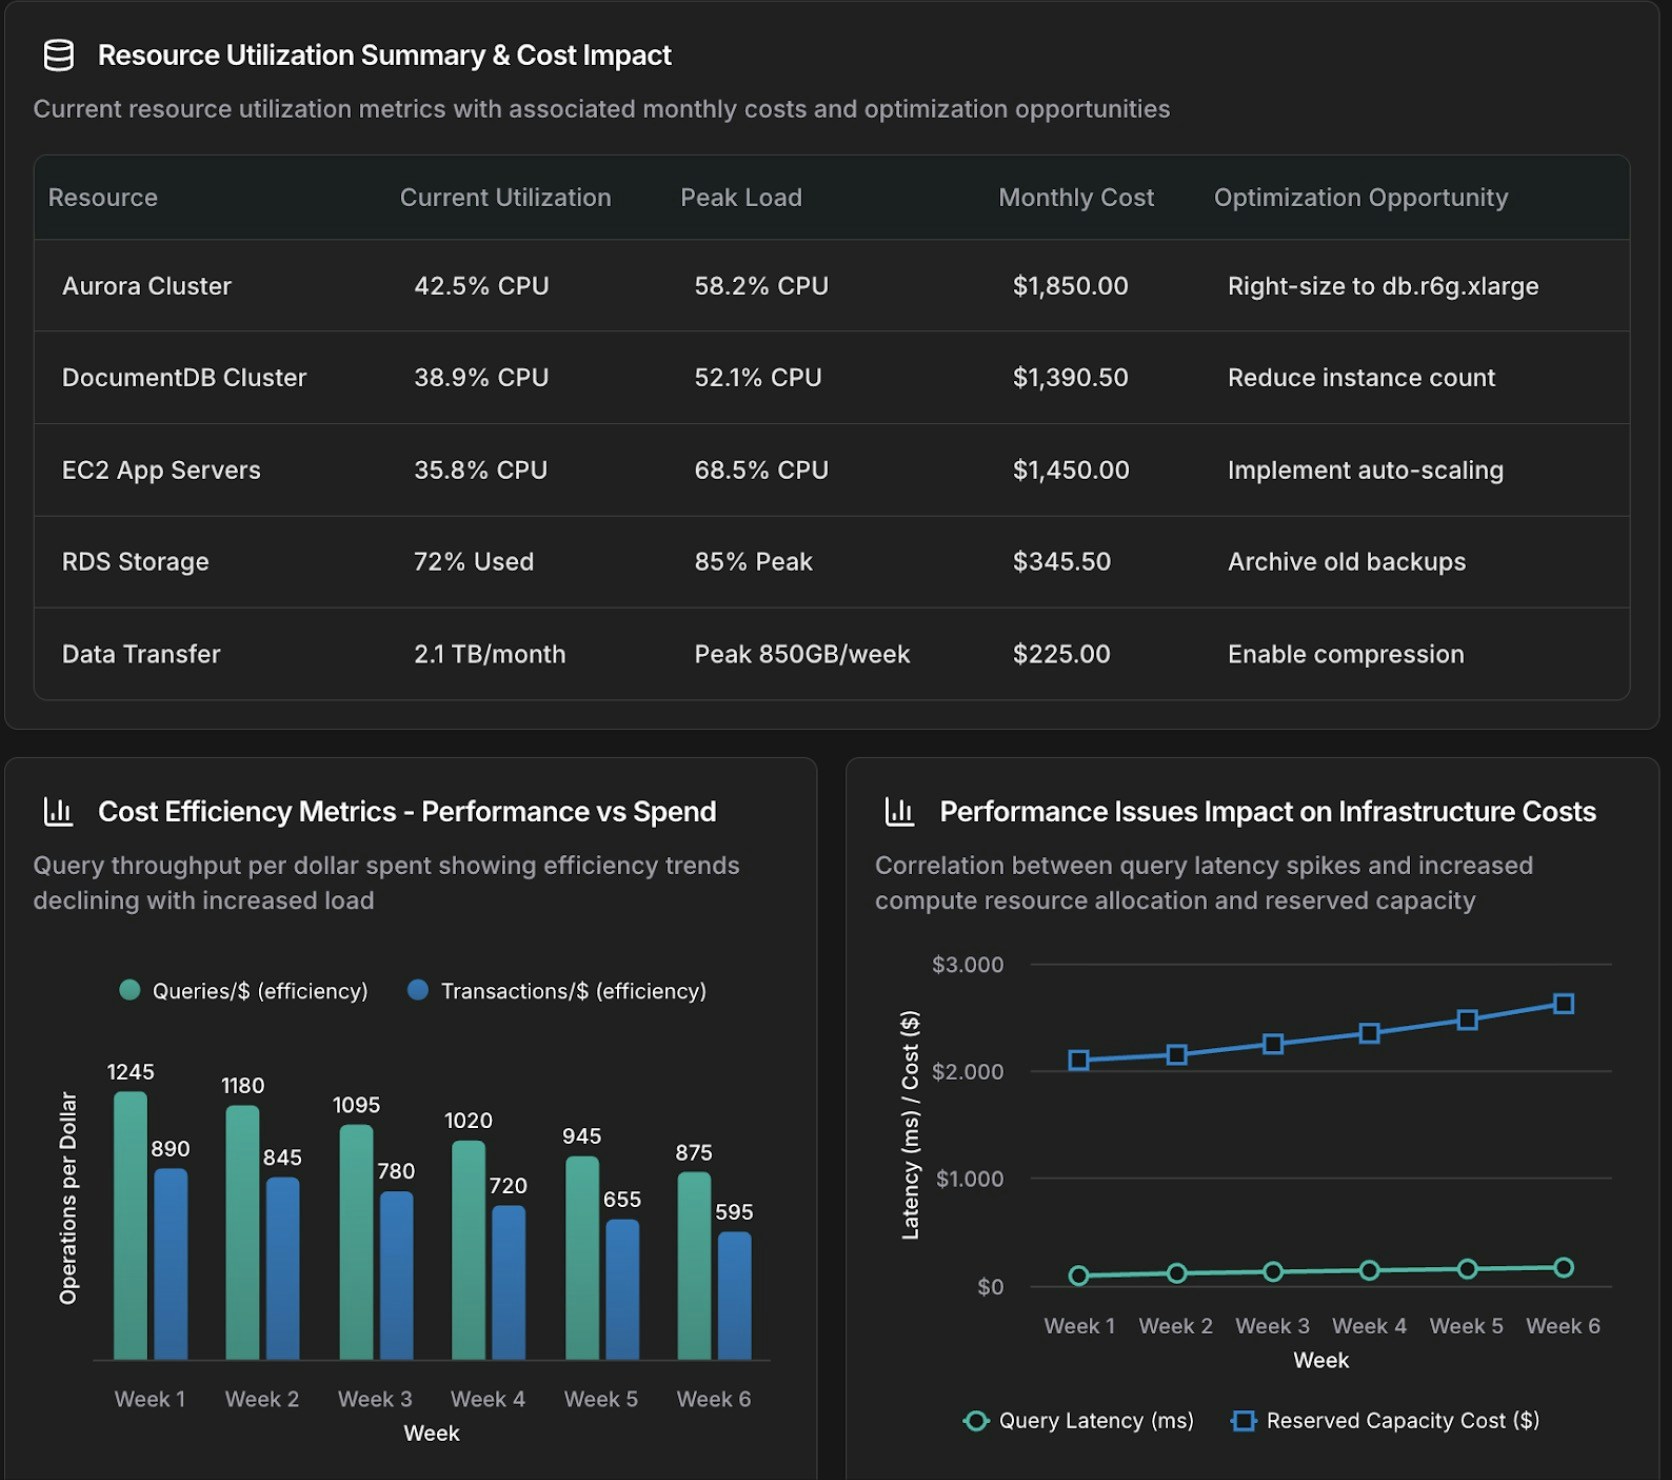
@anna #dashboard Create an operational dashboard correlating database performance with infrastructure costs for [time_period].Analyze:- Aurora and DocumentDB query performance metrics- Resource utilization and spending patterns- Correlation between database load and compute and storage costsContext: [recent changes, migrations, or specific concerns]
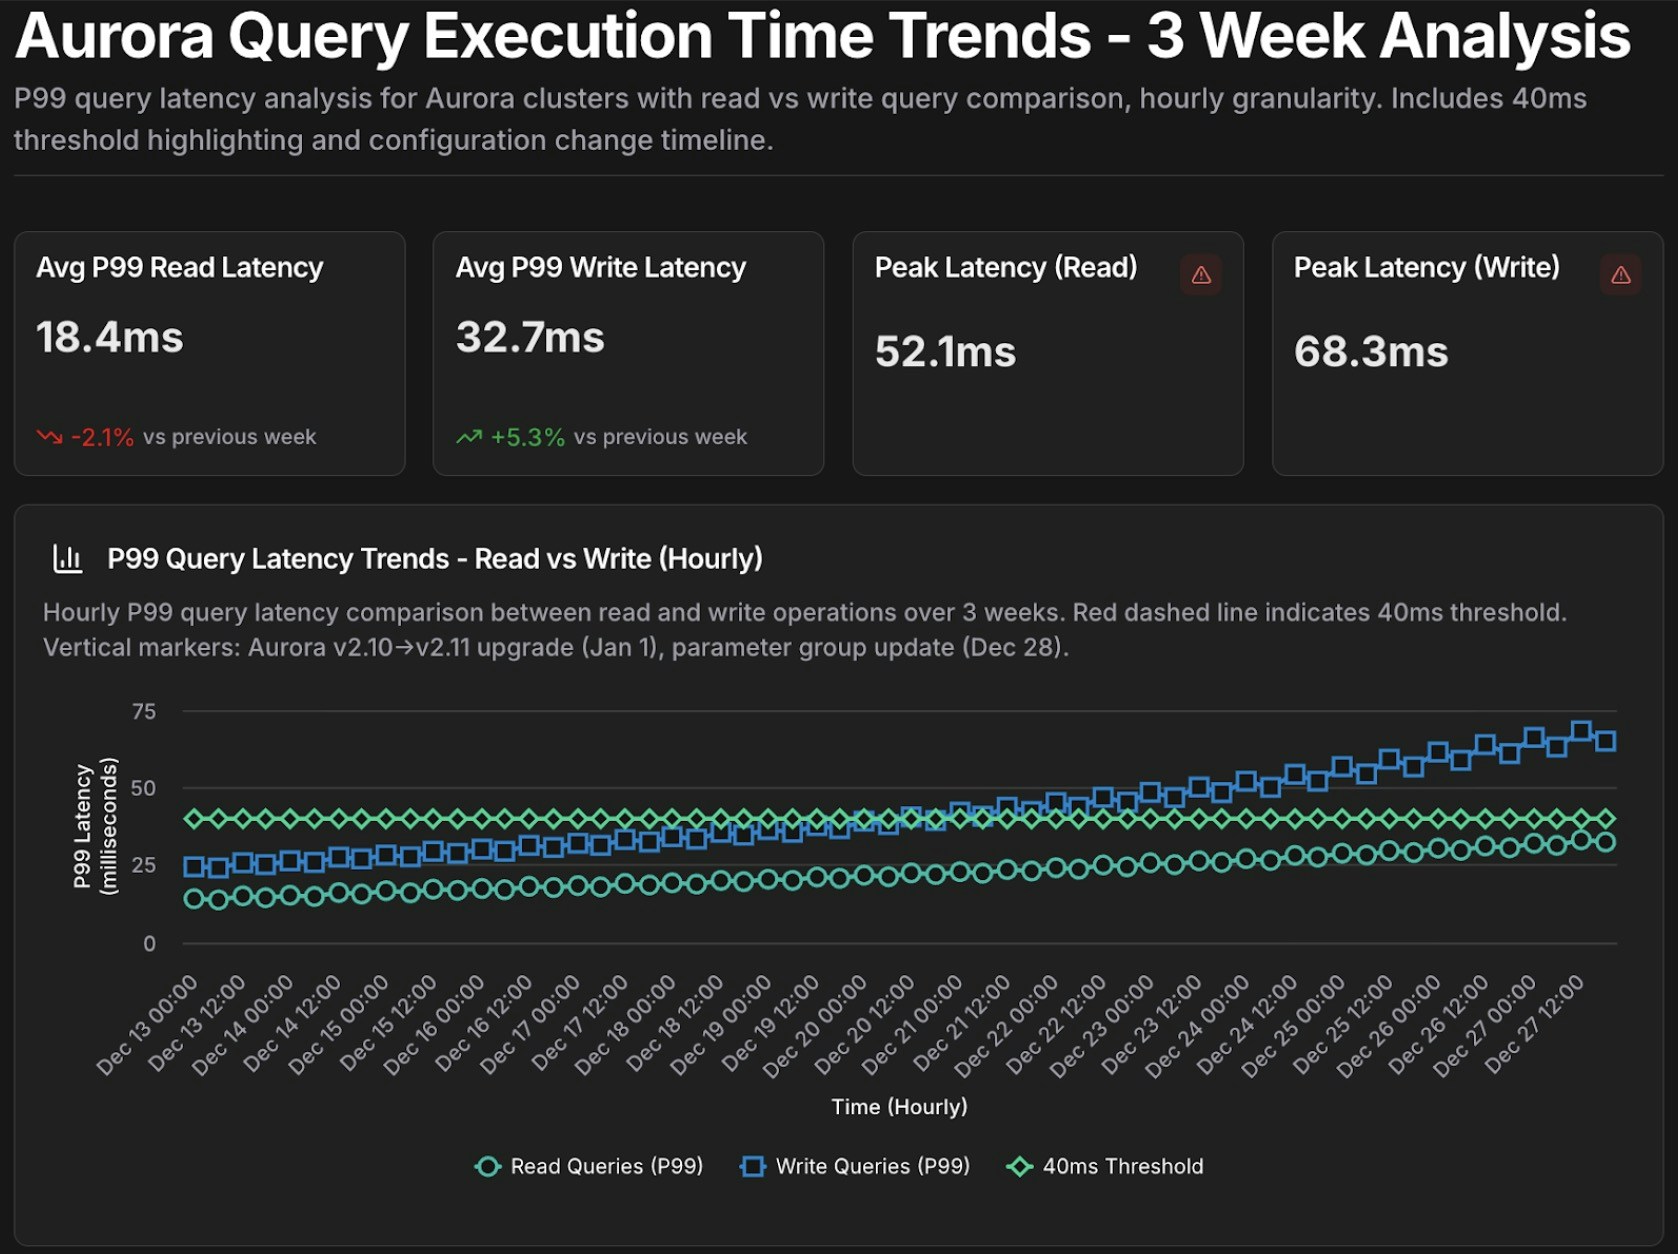
@tony #chart Show query execution time trends for Aurora cluster [cluster-identifier] over the past [time_period].- Metrics: p50, p95, p99 query latency- Separate lines for read queries vs write queries- Highlight queries exceeding [threshold] ms
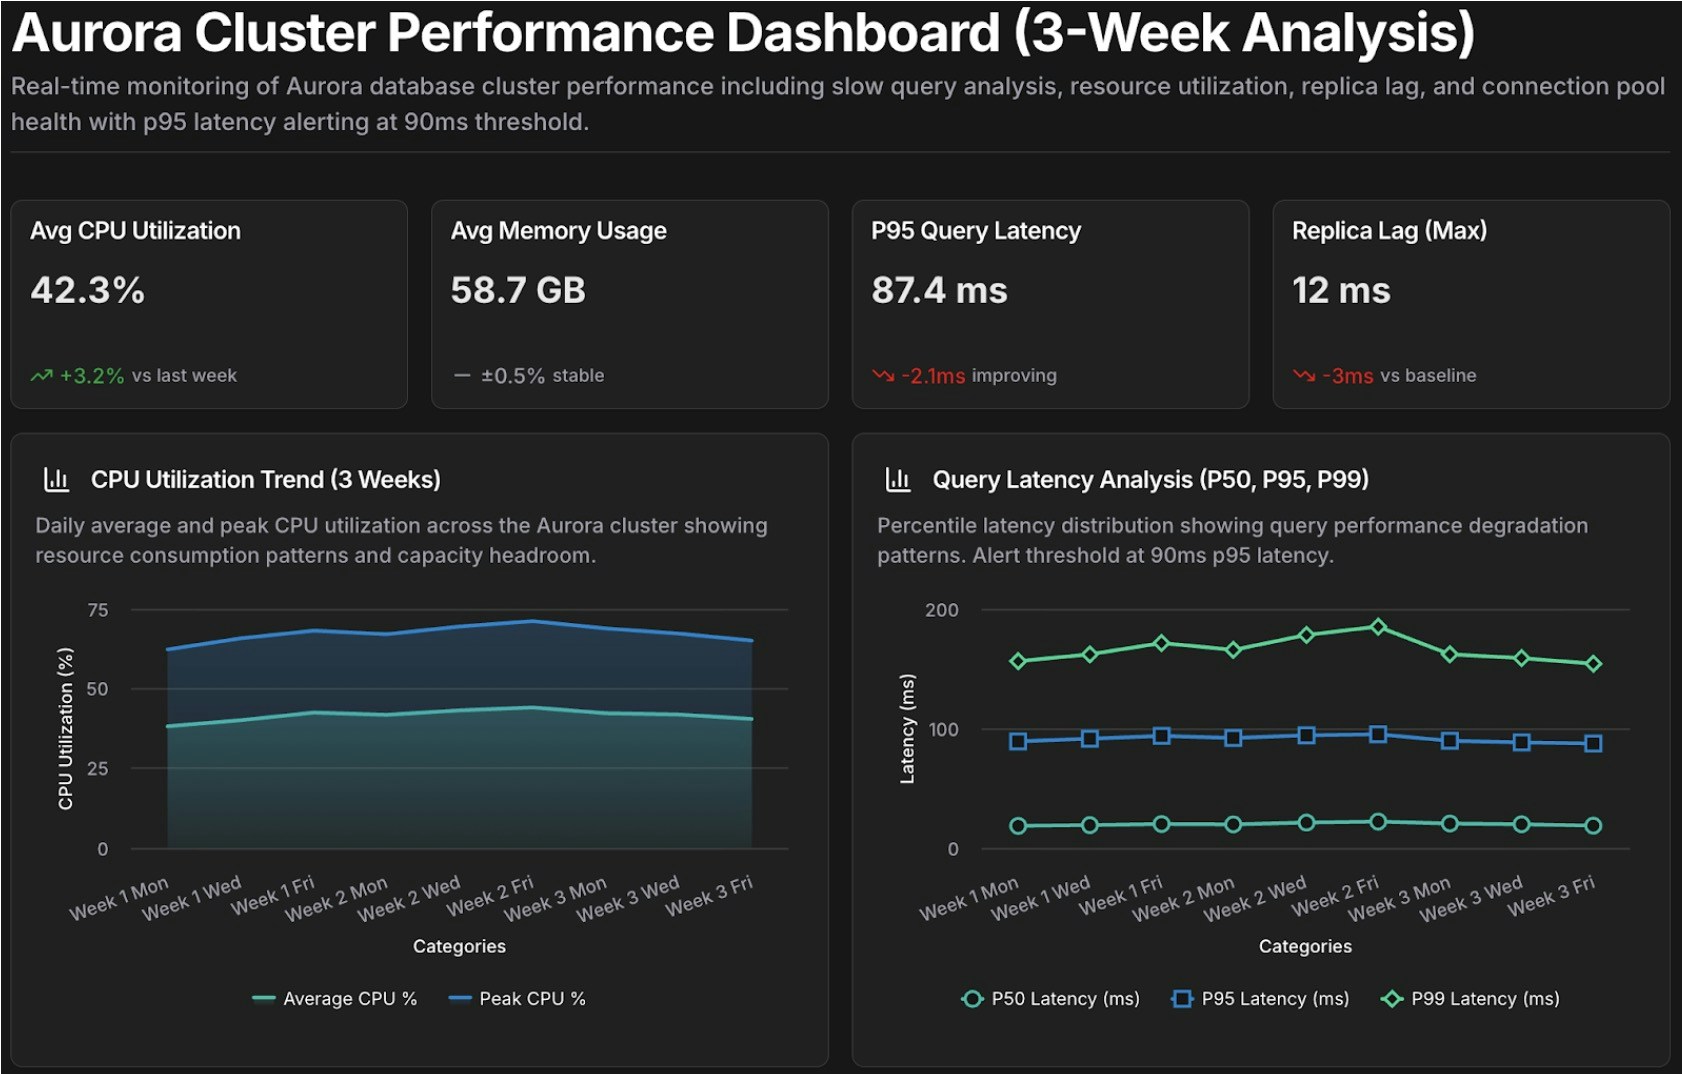
Template: database_performance_review@tony #dashboard Create a performance dashboard for Aurora cluster {cluster_id} covering {time_period}.Include:- Slow query analysis (queries exceeding {latency_threshold} ms)- Resource utilization trends (CPU, memory, IOPS)- Replica lag monitoring- Connection pool healthCompare against baseline: {comparison_period}Alert on: queries exceeding p95 latency of {latency_threshold} msTemplate: cost_anomaly_investigation@alex #report Investigate the cost anomaly for {service_name} on {date}.- Compare costs to the 7-day and 30-day averages- Break down by cost component (compute, storage, I/O, data transfer)- Identify the specific resources driving the increase and quantify the impact- Recommend immediate actions to mitigate ongoing cost increases