The scenario
A platform team runs a production EKS cluster across several namespaces. CPU alerts are intermittent but investigation is slow—engineers run manualkubectl commands across hundreds of pods to correlate logs, metrics, and events.
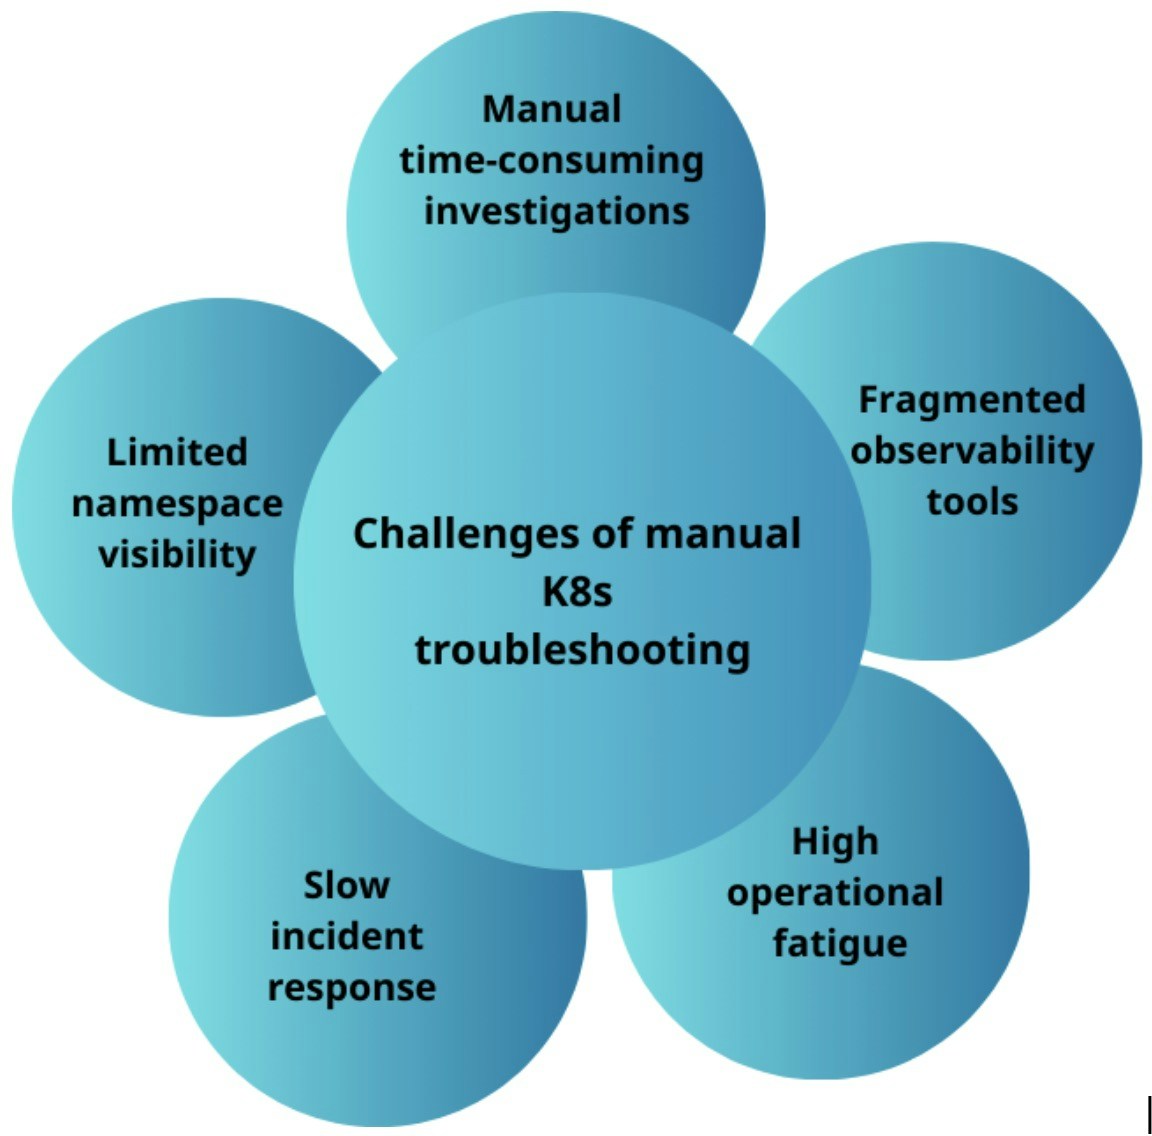
Manual Kubernetes troubleshooting challenges
The team asks Kai to assess the cluster end-to-end, identify resource waste, and recommend autoscaling policies where they are missing.Walkthrough
1
Connect Kai to your cluster
2
Follow the Kubernetes connection guide to give Kai access to your EKS cluster. Once the connection shows Connected, Kai can query the cluster directly.
3
Analyze pod resource utilization
4
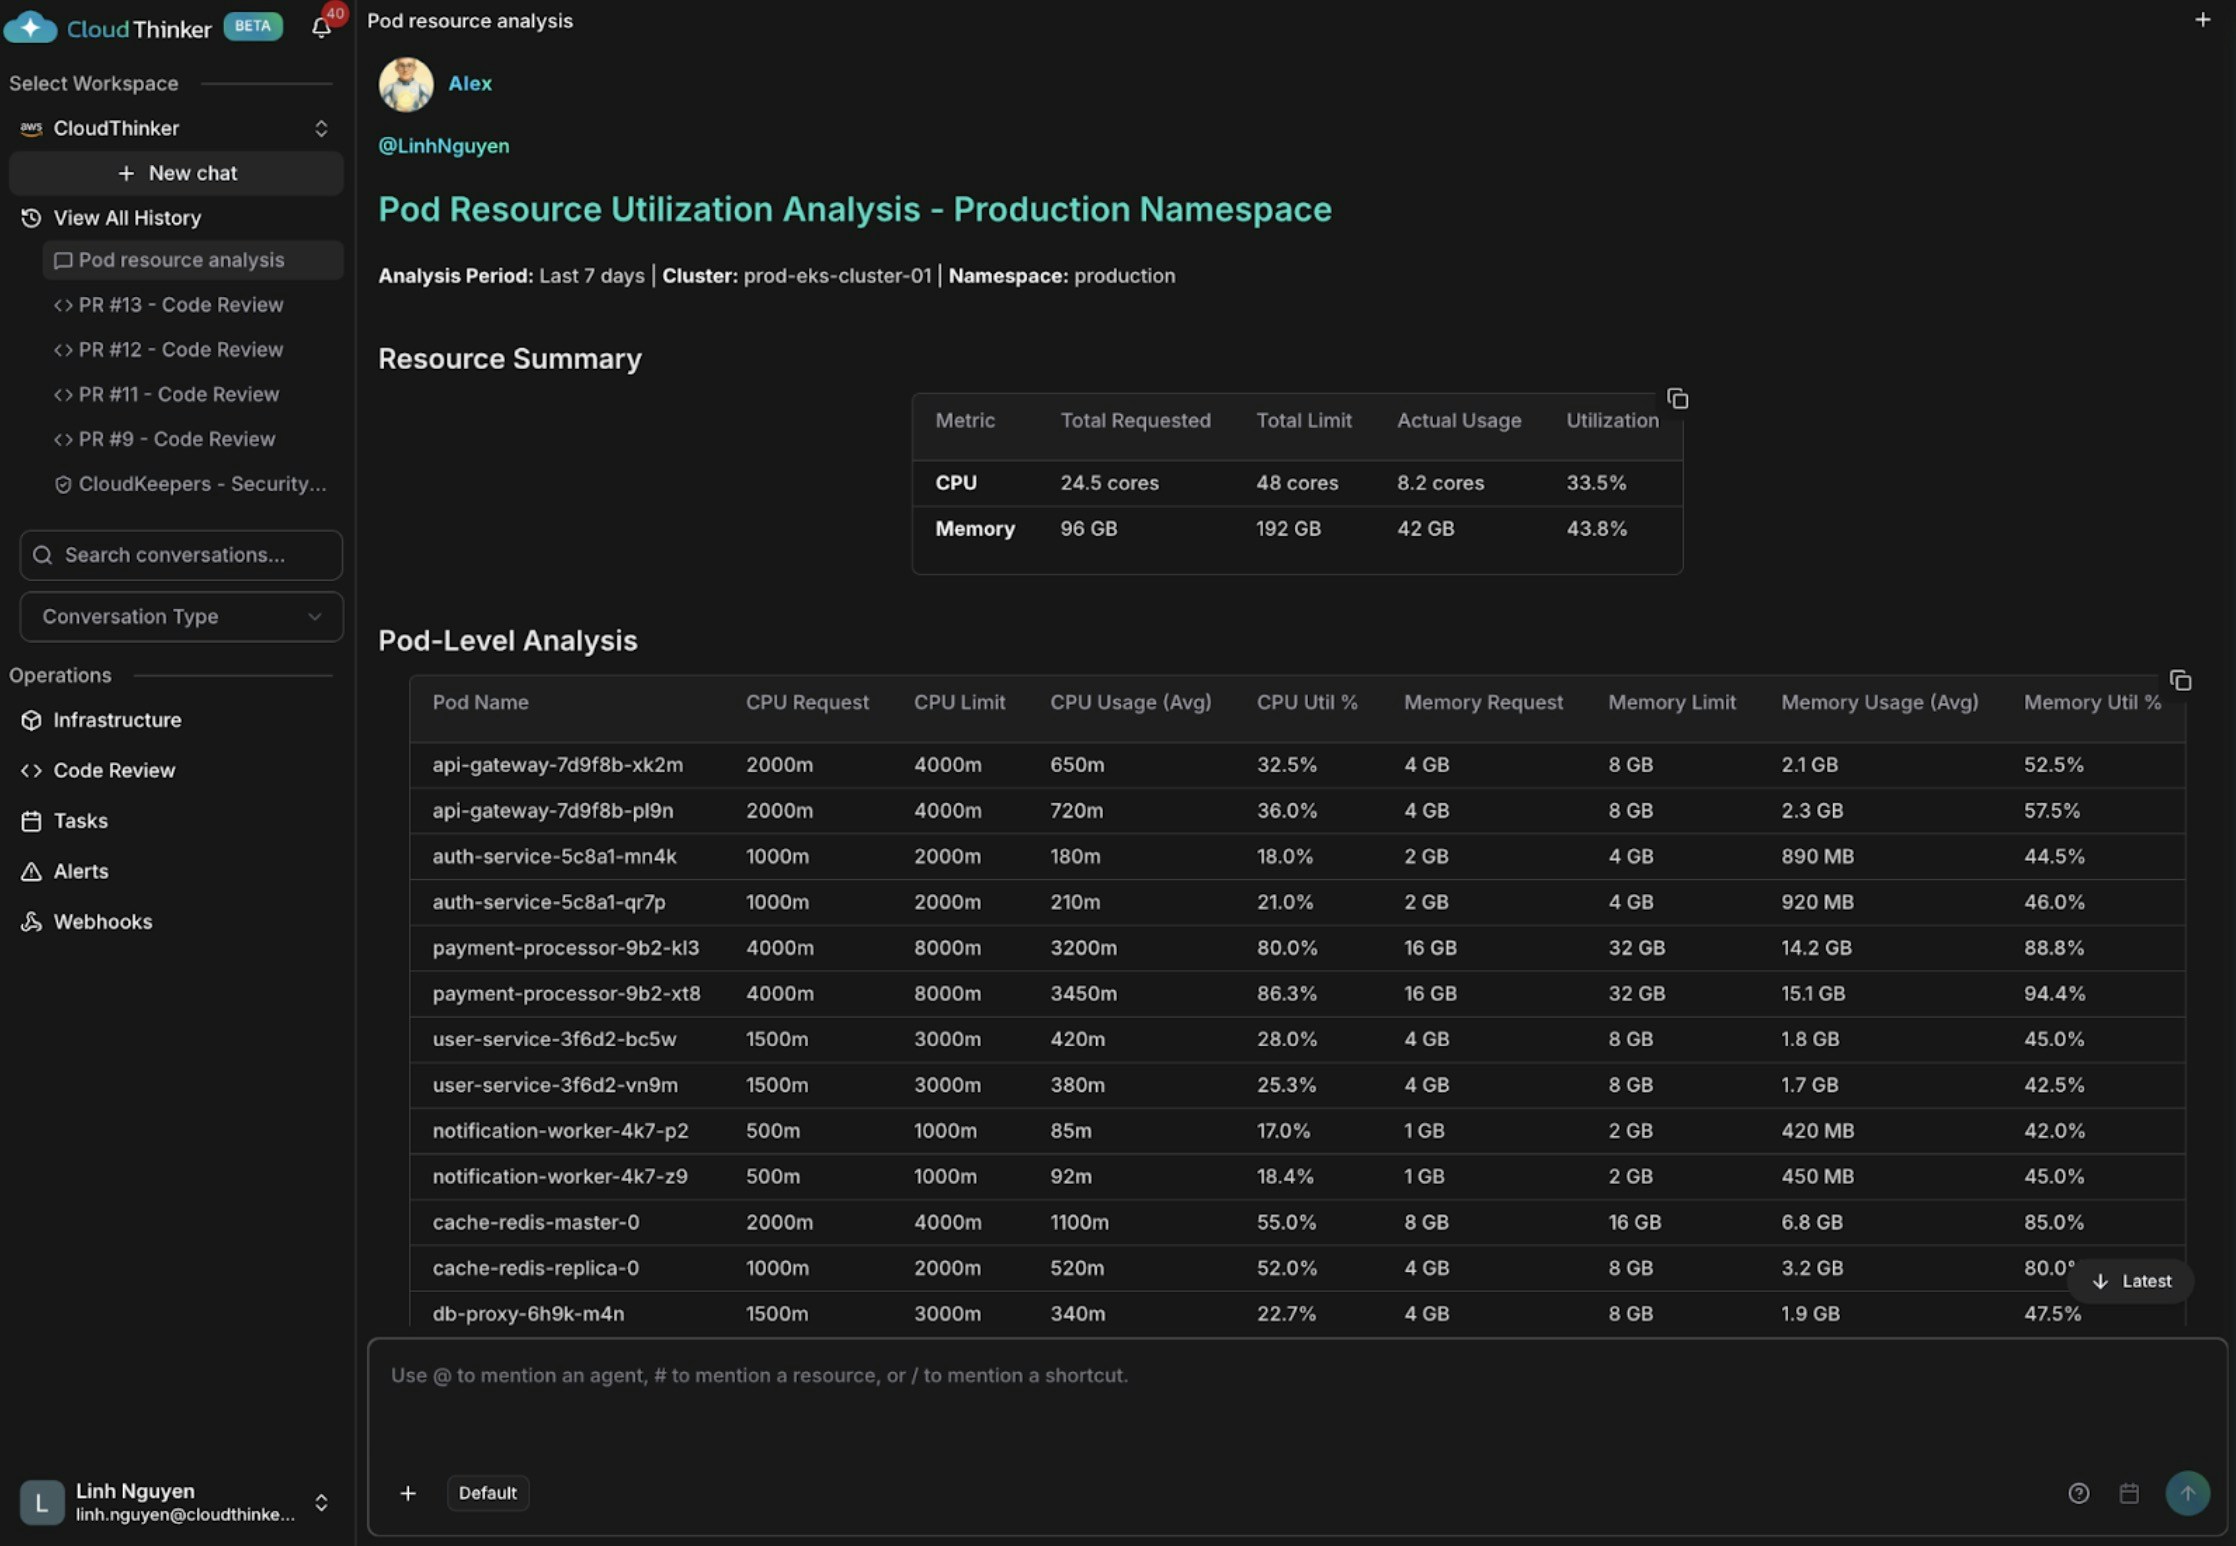
@kai #report analyze pod resource utilization in production namespace
5
6
Pod resource utilization analysis
7
8
Pod analysis visualization with performance recommendations
9
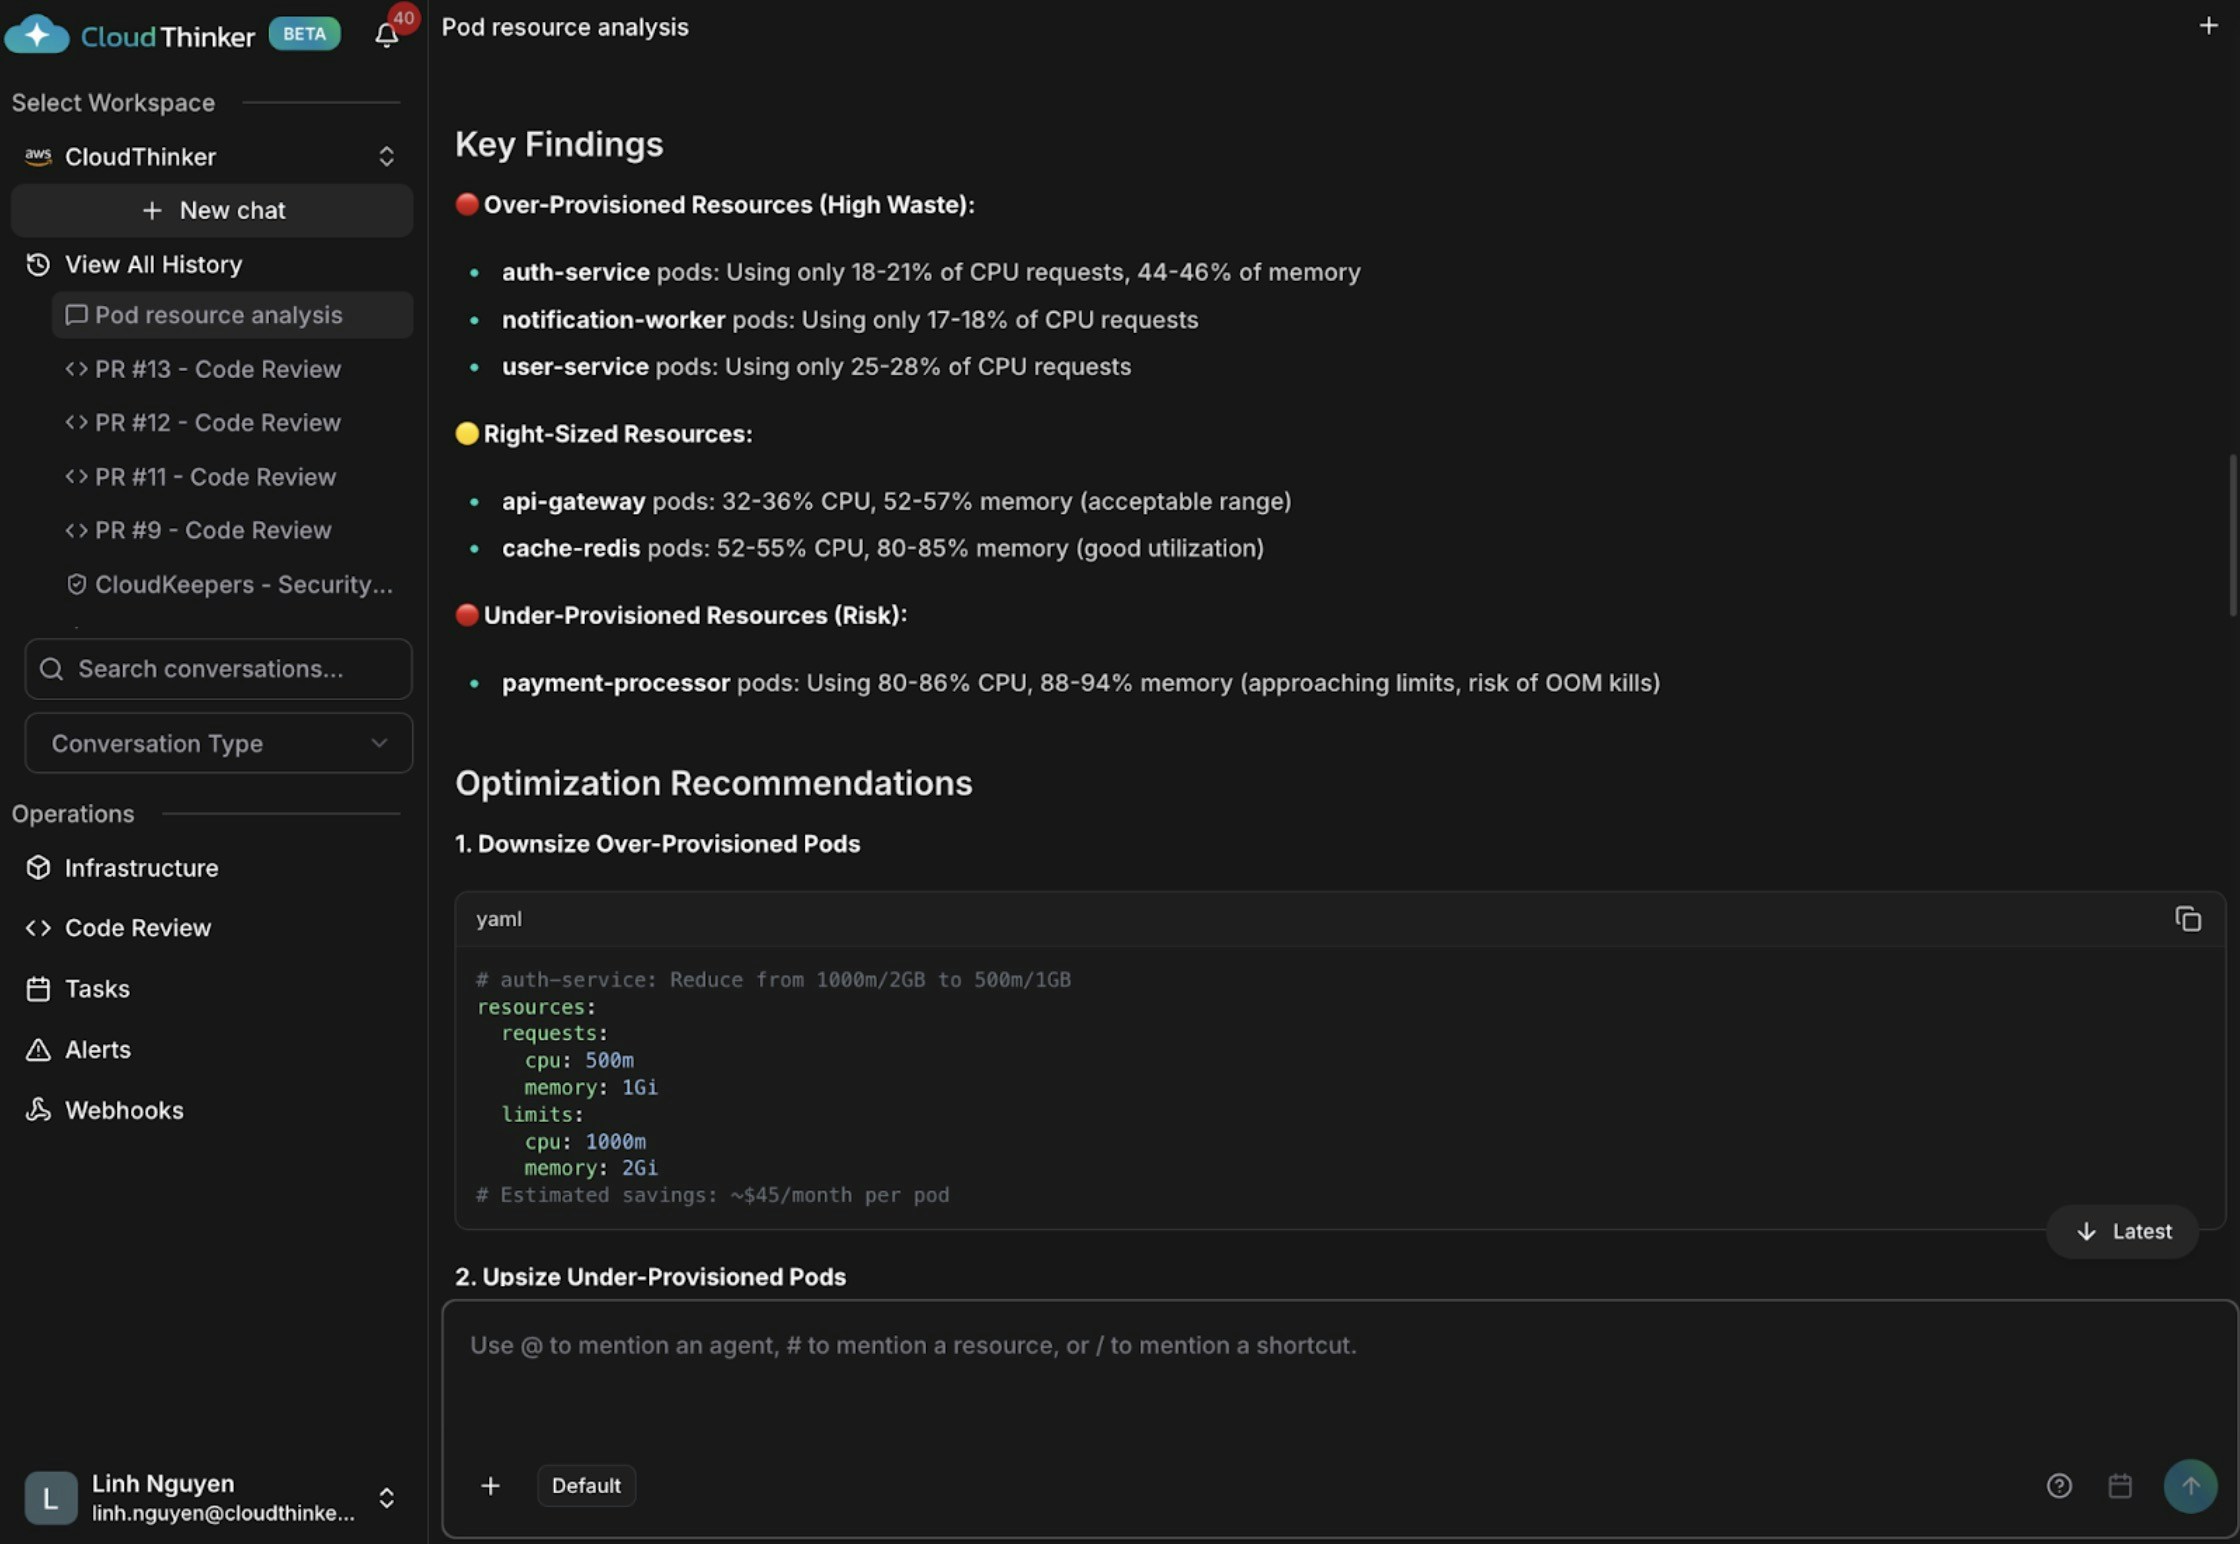
Kai surfaces three findings: auth-service and notification-worker are over-provisioned (18–21% CPU), api-gateway and cache-redis are appropriately sized, and payment-processor is dangerously under-provisioned at 80–86% CPU and 88–94% memory—at high risk of OOM kills and service disruption.
10
Identify underutilized nodes
11
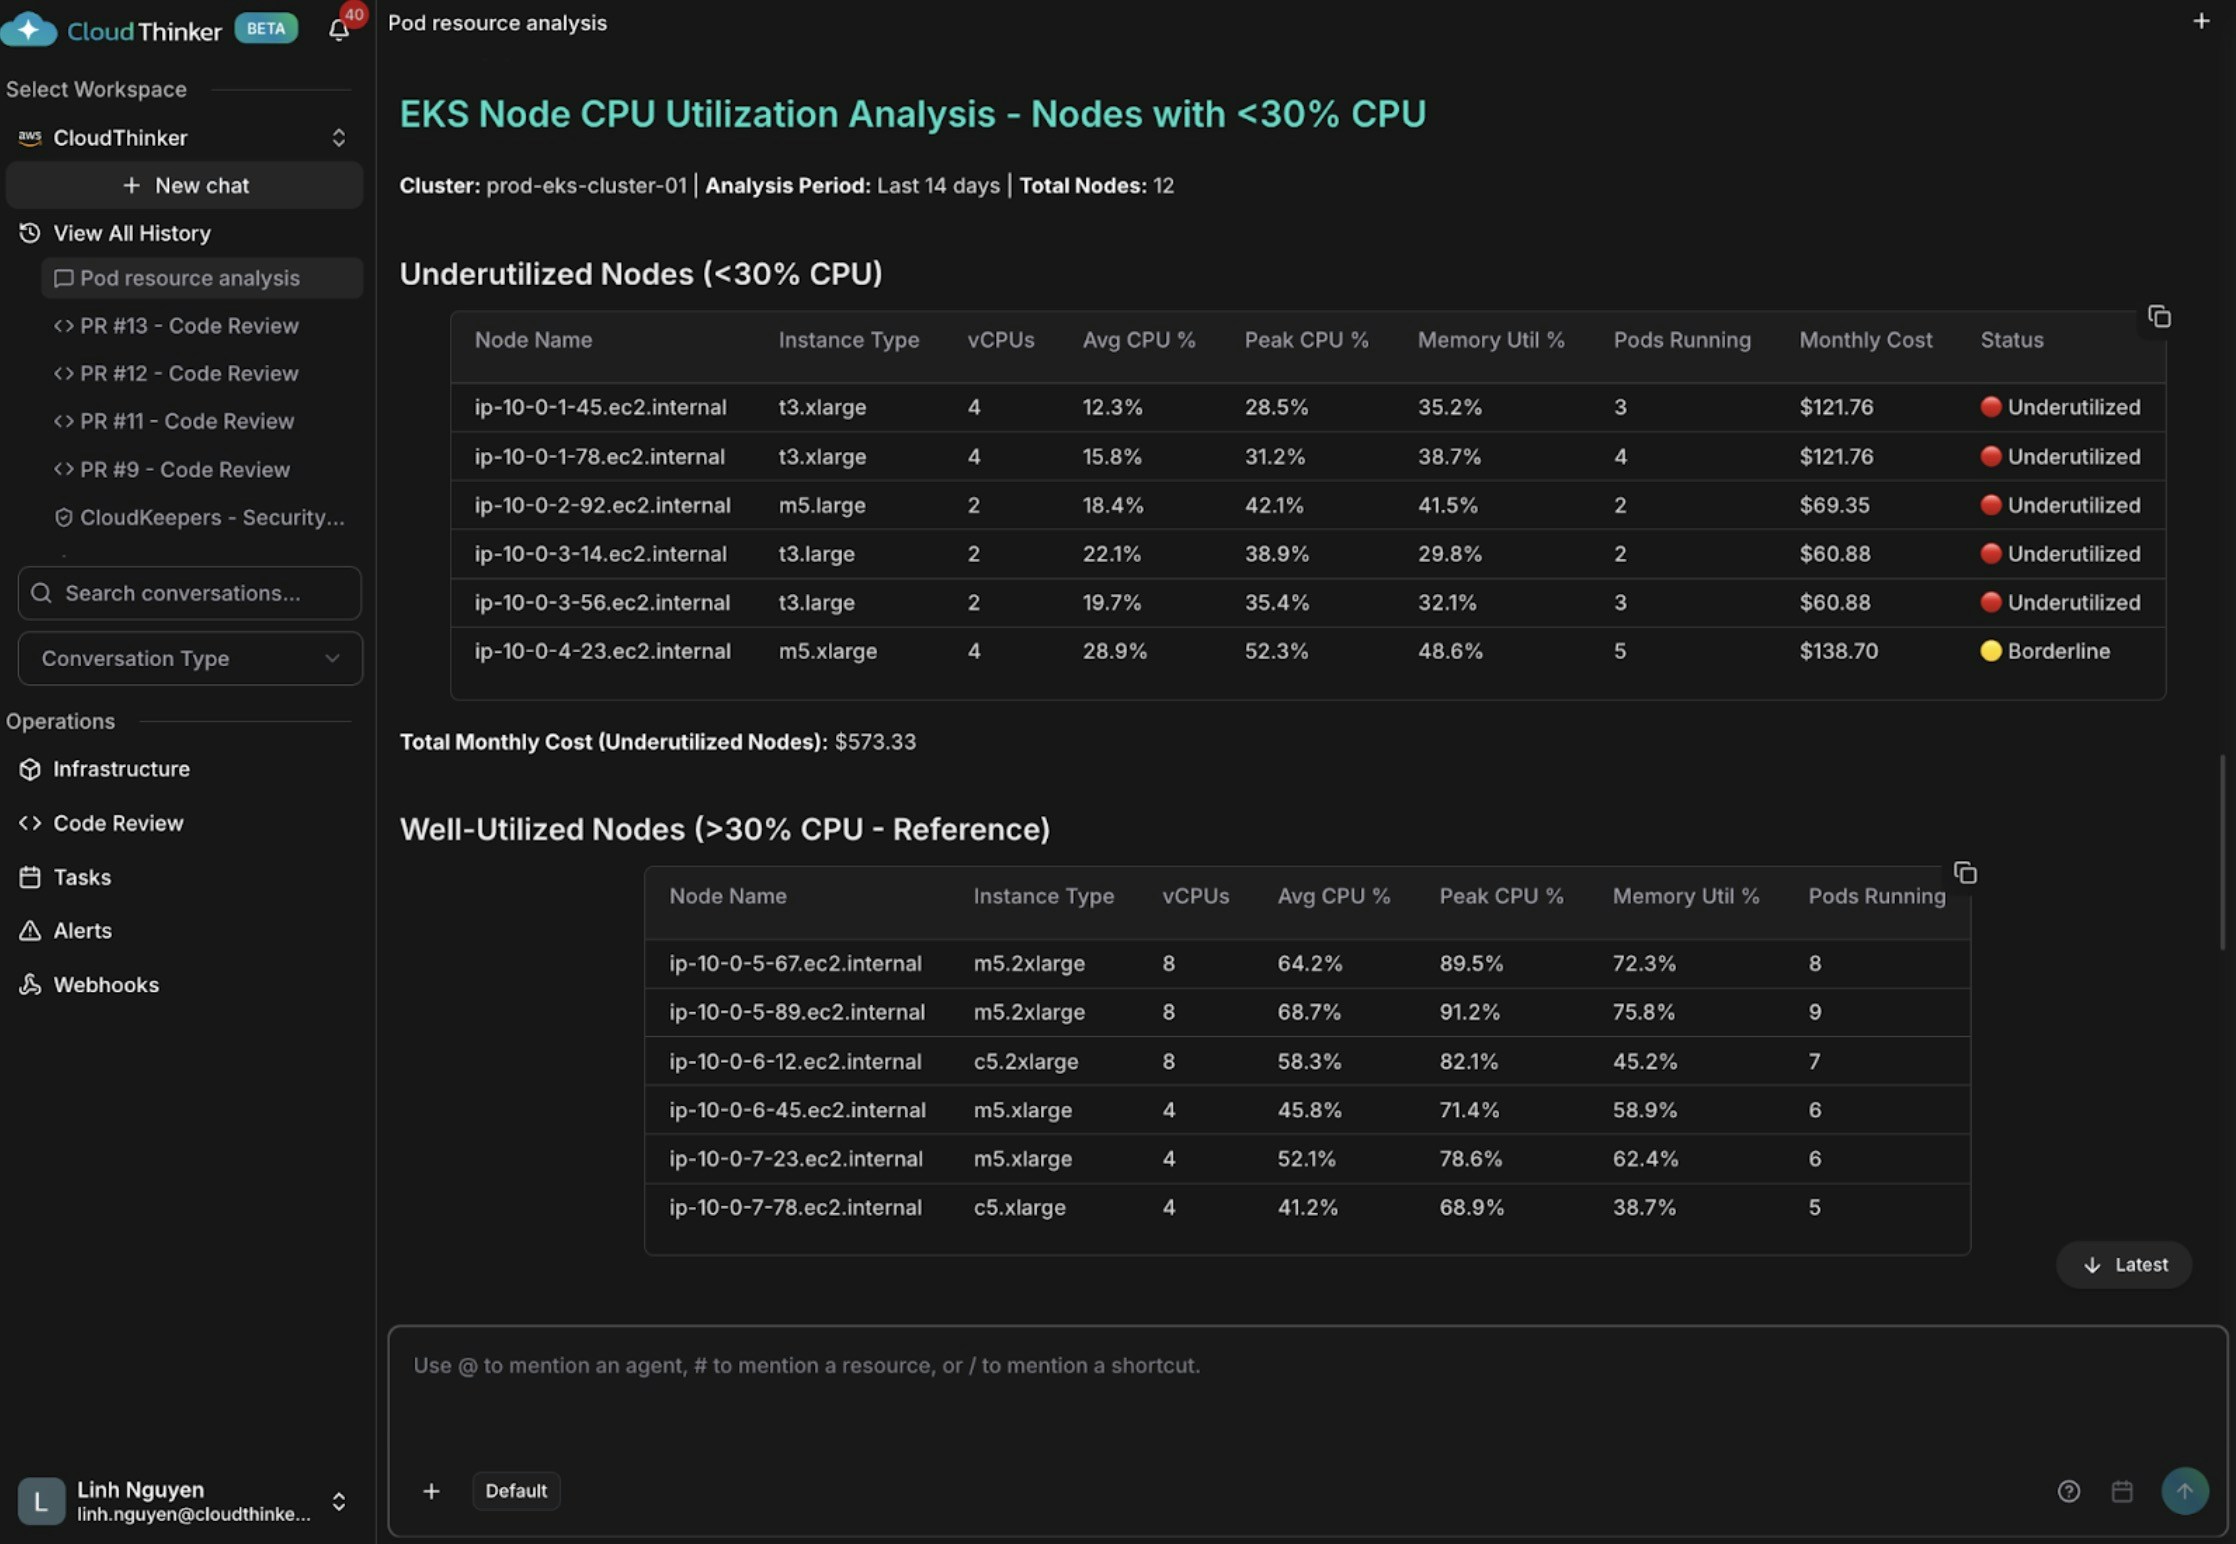
@kai #chart identify nodes with <30% CPU utilization
12
13
Node CPU utilization analysis showing underutilized instances
14
Kai finds five nodes averaging below 30% CPU (some as low as 12–15%), wasting approximately $573 per month. Oversized t3.xlarge instances running lightweight workloads—combined with poor pod scheduling—leave some nodes with only 2–3 pods while others carry 8–9.
15
Get HPA recommendations
16
@kai #recommend HPA policies for web deployments
17
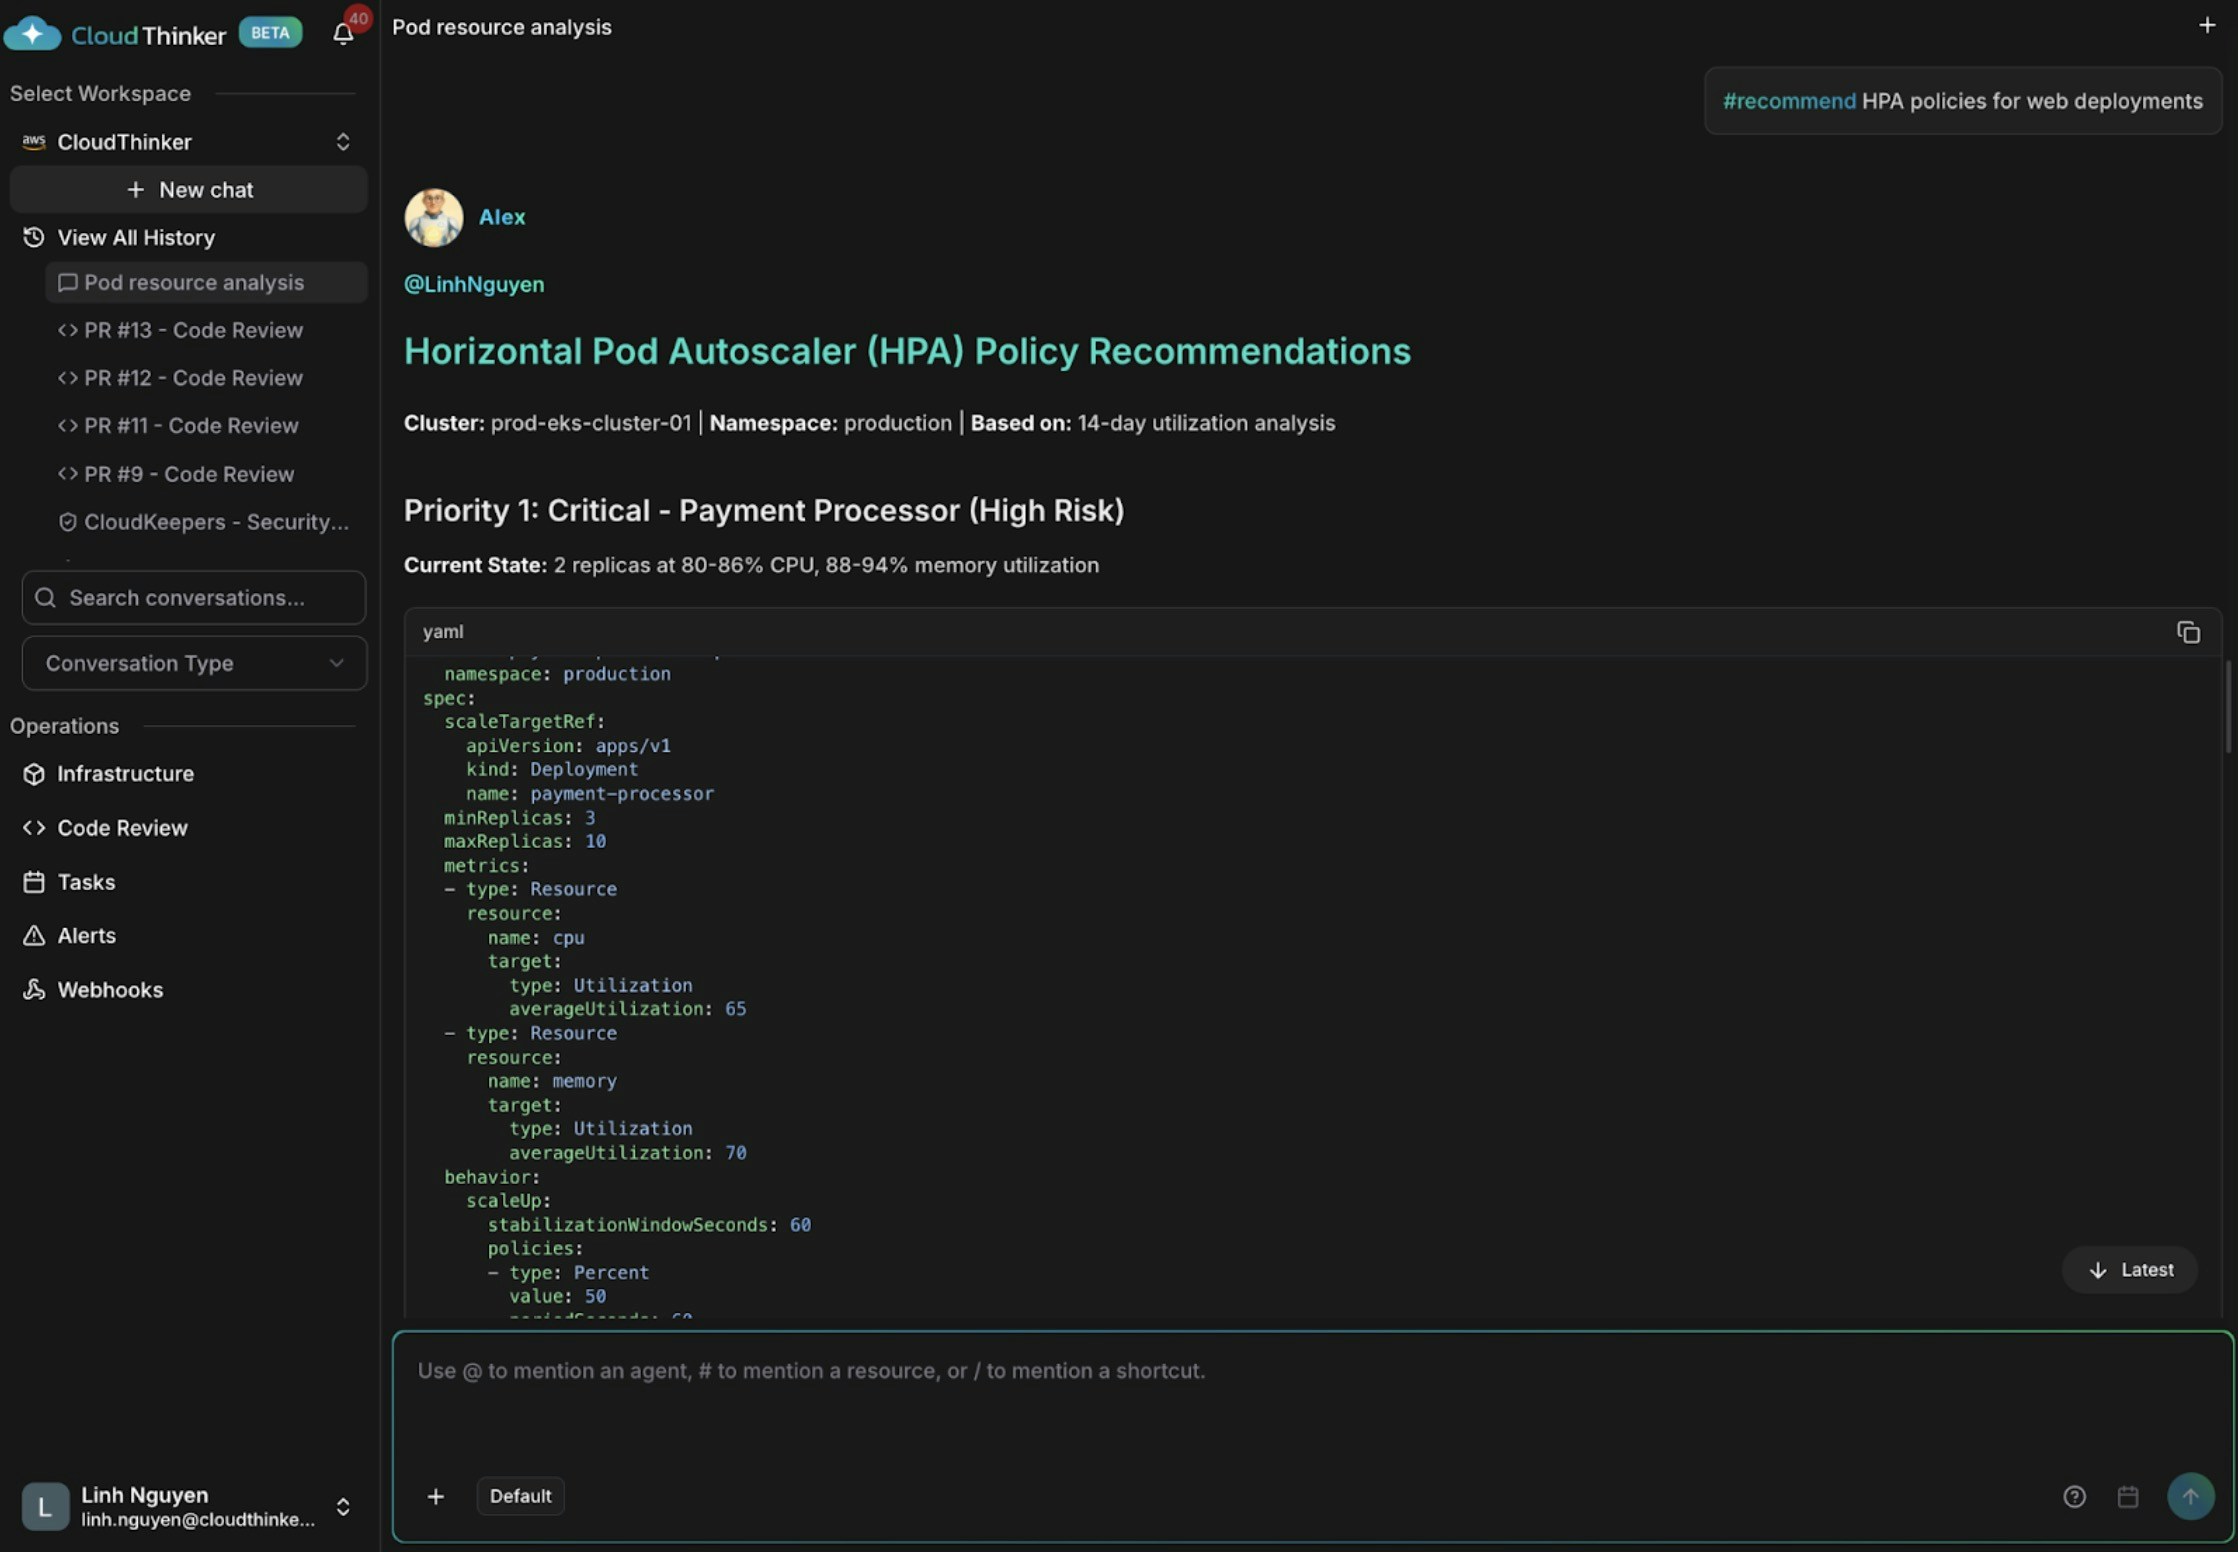
18
HPA policy recommendations for auto-scaling
19
Kai flags payment-processor as critically at risk—only 2 replicas at 80–86% CPU, no autoscaling in place. It recommends adding HPA to api-gateway to handle traffic spikes, and removing excess capacity from user-service and auth-service.
What made this work
- Kai queries the cluster API directly, replacing manual
kubectlsessions and tool-switching. - Cross-layer correlation links pod utilization, node capacity, and scheduling patterns in a single analysis pass.
#reportand#chartproduce structured output Kai can reason over before surfacing findings.#recommendgenerates actionable HPA policy changes rather than a raw metrics dump.- CloudKeepers can run this analysis on a schedule so findings arrive before on-call engineers are paged.
Try it yourself
Kai agent reference
Full capabilities of Kai, the Kubernetes Engineer agent
Kubernetes connection
Step-by-step guide to connecting CloudThinker to your EKS cluster
Topology Explorer
Map Kubernetes service dependencies for faster incident root cause analysis
CloudKeepers
Run continuous health checks across your Kubernetes workloads automatically