Documentation Index
Fetch the complete documentation index at: https://docs.cloudthinker.io/llms.txt
Use this file to discover all available pages before exploring further.
The role of observability in incident response
Production observability systems need three key requirements:- Unified visibility: Correlate logs, metrics, and traces from multiple services to understand failure propagation through microservices and trace issues to origin
- Real-time correlation: Preserve relationships between applications, databases, queues, and infrastructure to quickly determine if issues are local or dependency-driven
- Automated analysis with contextual intelligence: AWS provides CloudWatch, X-Ray, and CloudWatch Logs, but these generate massive data volumes requiring human interpretation. CloudThinker adds intelligent analysis that automatically correlates signals, identifies anomalies, and explains root causes in business context
This page focuses on the Incident pillar of the Deep Response Engine. Upstream of investigation, Pulse ingests signals from 10+ sources, applies seven suppression layers to remove ~98% of noise, and correlates the rest into clusters — so RCA only fires for events that are actually actionable.
Challenges with traditional incident response workflows
Manual investigation delays: Engineers manually grep CloudWatch Logs across log groups, correlate with CloudWatch metrics, and trace requests through X-Ray extending customer impact Siloed expertise: Application teams, DBAs, and infrastructure teams investigate sequentially in their domains, discovering root causes outside their area after wasting time this handoff-intensive process increases MTTR Cross-service correlation: Applications span RDS Aurora, DocumentDB, Lambda, ECS/EKS, and external dependencies. Understanding how database timeouts cause checkout failures requires pulling data from RDS metrics, VPC Flow Logs, ALB access logs, and application logs each with different query languages and access patterns, consuming hours to reconstruct failure timelinesSolution: CloudThinker’s agentic approach to automated RCA
CloudThinker uses specialized AI agents coordinated by a Multi-Agent System that automatically investigate across the entire stack, correlate signals, and generate comprehensive RCA documentation within minutes. Specialized agents:- Tony (Database Administrator): Analyzes RDS Aurora and DocumentDB performance, identifies slow queries, connection pool exhaustion, resource constraints
- Alex (Cloud Engineer): Examines AWS infrastructure including EC2, load balancers, VPC networking
- Kai (Kubernetes Specialist): Investigates pod health, container restarts, resource limits, service mesh configurations on Amazon EKS
- Oliver (Security Engineer): Analyzes security groups, network policies, IAM permissions, security-related failure modes
Real-World Investigation: EC2 Terminations and EKS Network Issues
Consider a scenario where CloudThinker’s continuous monitoring detects two concerning patterns: Critical Finding 1: Frequent EC2 Instance Terminations Critical Finding 2: EKS Network Issues This investigation demonstrates how to use CloudThinker’s agents to analyze these interconnected infrastructure issues systematically.Step 1: Analyze EC2 termination patterns with Alex
Analyze AutoScaling termination patterns: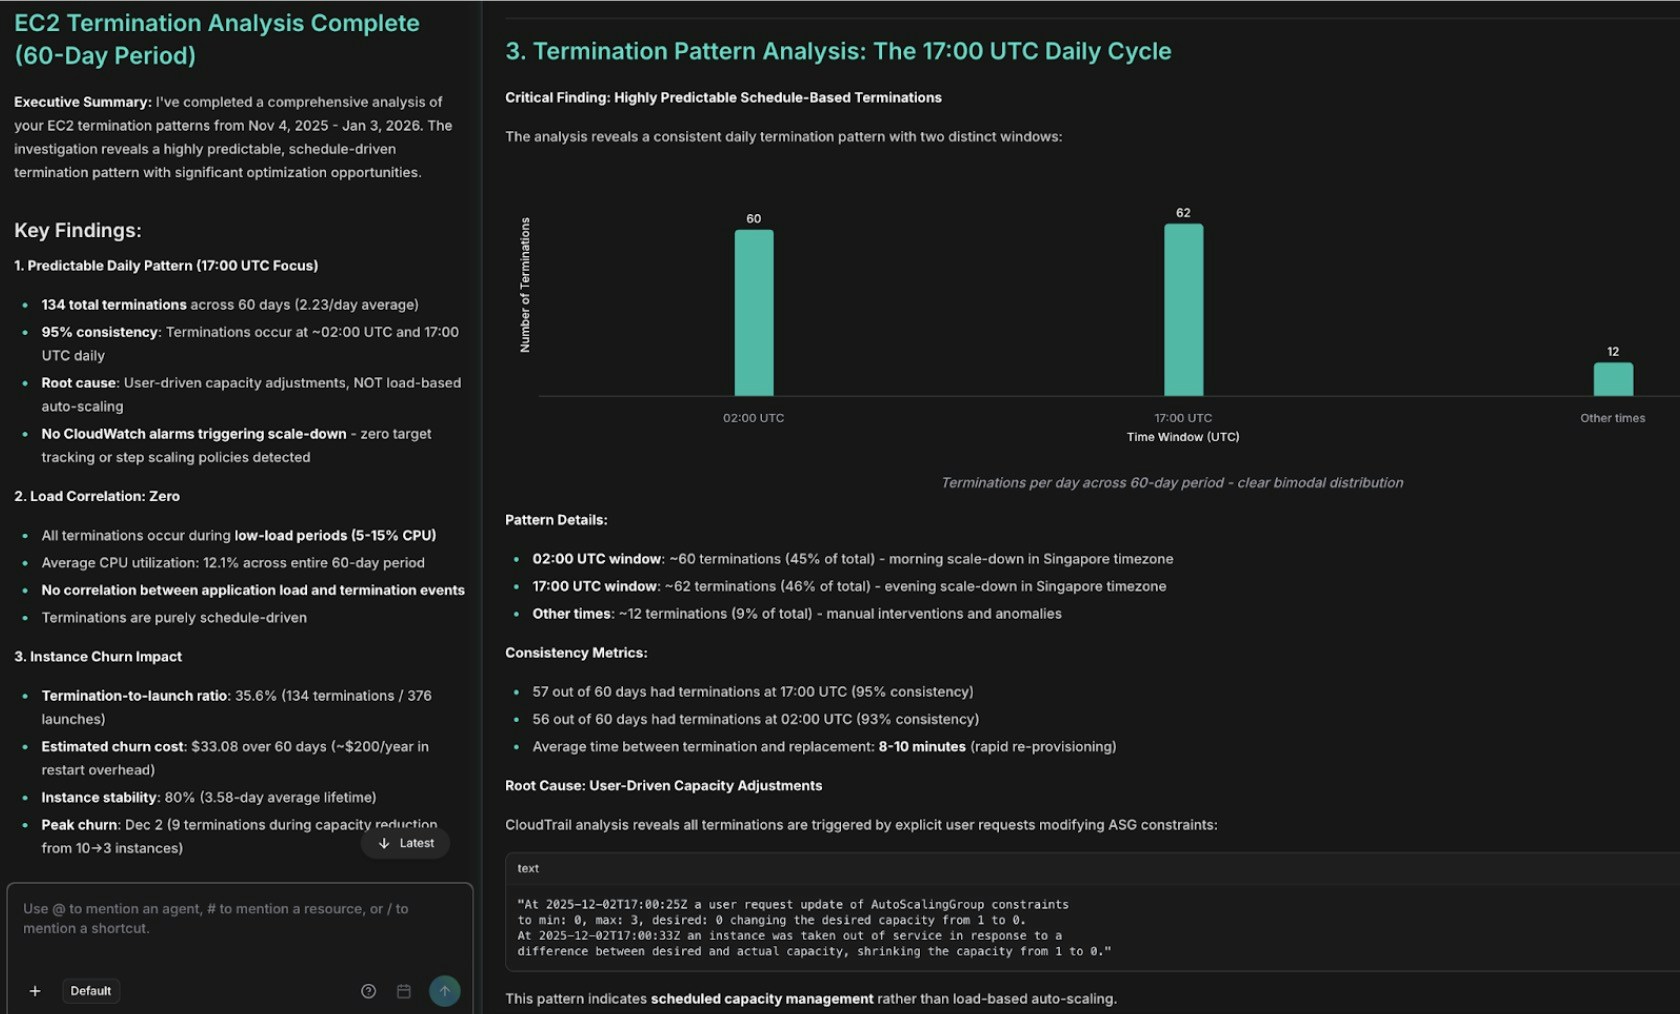
EC2 termination pattern analysis showing AutoScaling events
Step 2: Investigate EKS network interface failures with Kai and Alex
Cross-correlate network failures with instance terminations: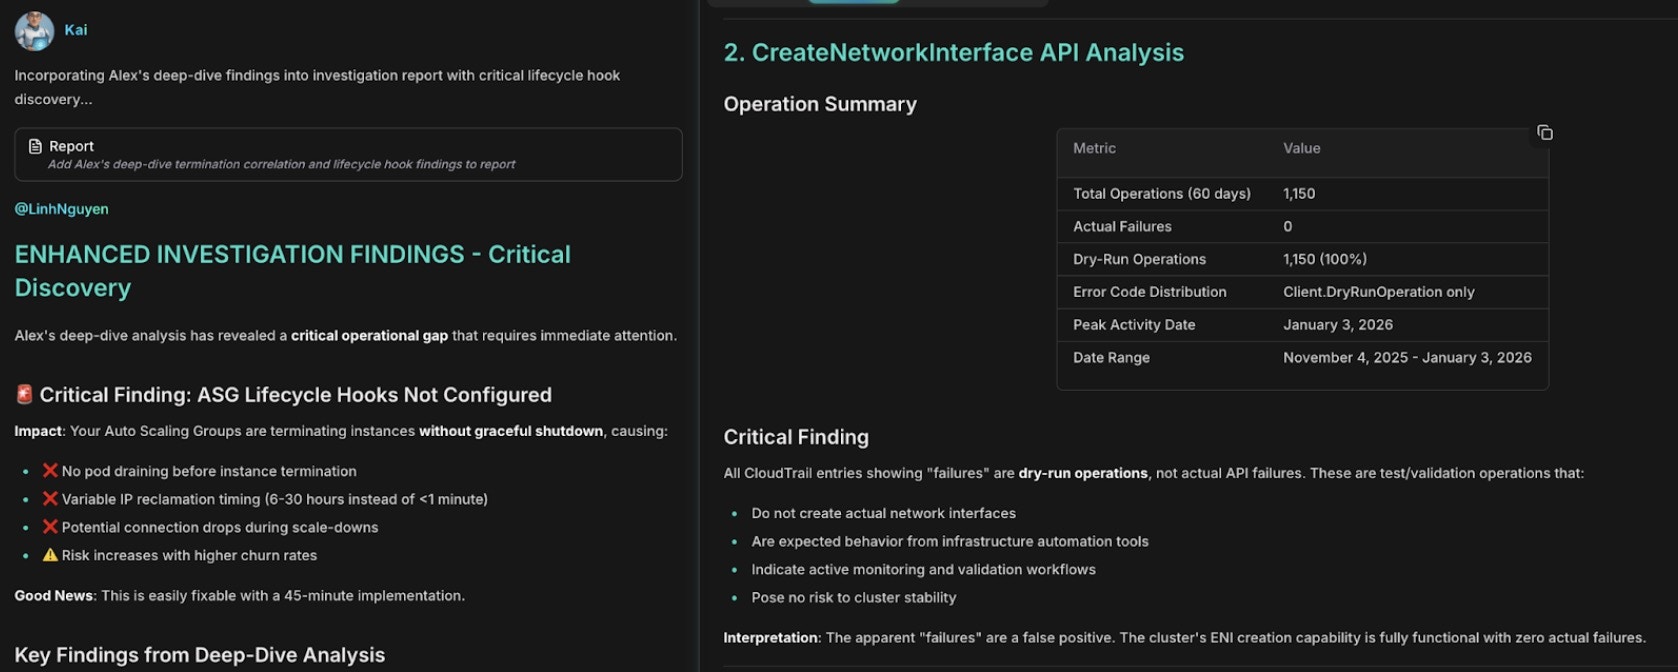
Network failure correlation with CreateNetworkInterface errors and IP exhaustion
Step 3: Generate comprehensive RCA report with Anna
After completing the multi-agent investigation, use Anna to synthesize all findings into an executive RCA report: Generate complete RCA documentation: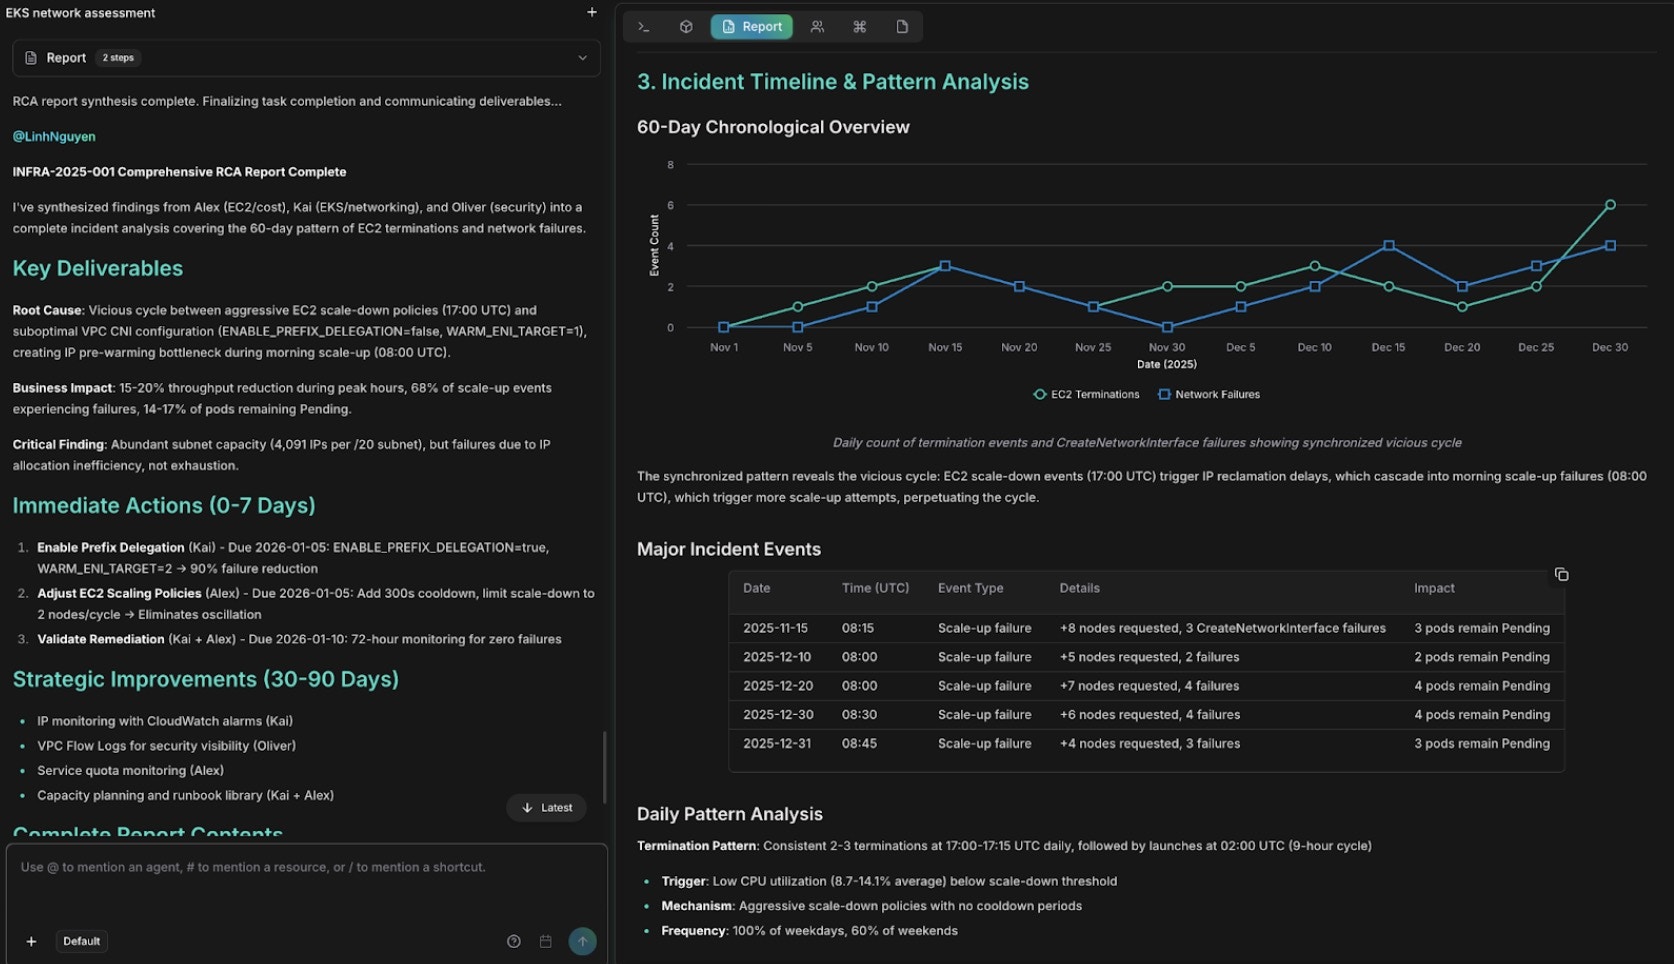
Comprehensive RCA report with findings and remediation steps
This comprehensive RCA report demonstrates how CloudThinker synthesizes findings from multiple agents (Alex for infrastructure and cost, Kai for EKS networking, Oliver for security) into actionable documentation that includes technical details, business impact quantification, remediation steps, and preventive measures—all generated automatically in minutes rather than requiring hours of manual documentation effort.Comparing CloudThinker with traditional incident response approaches
| Dimension | Traditional Incident Response | CloudThinker Automated RCA |
|---|---|---|
| Time to Root Cause | 30-120 minutes with sequential investigation across teams | 2-10 minutes with parallel agent investigation |
| Expertise Required | Deep knowledge of grep, AWS CLI, CloudWatch Logs Insights, and log correlation | Visual pattern recognition on topology plus natural language prompts |
| Cross-Service Visibility | Very difficult—requires querying multiple systems sequentially and manually correlating findings | Immediately visible through Topology Explorer with automated correlation |
| Documentation Time | Manual hours after incident resolution, often delayed or incomplete | Instant generation via #report command with comprehensive analysis |
| Investigation Approach | Reactive sequential troubleshooting check app logs, then DB metrics, then network, etc. | Proactive parallel analysis all agents investigate simultaneously across the stack |
| Dependency Mapping | Mental model or outdated architecture diagrams, often incomplete | Real-time topology from actual AWS service dependencies and traffic patterns |
| Alert Fatigue | High multiple teams receive alerts, many false positives require manual triage | Reduced agents provide context and severity assessment automatically |
| Post-Incident Learning | Varies widely depends on engineer’s documentation thoroughness and time availability | Consistent high-quality RCA reports with actionable recommendations |
What’s Next
Pulse
Upstream signal intelligence — 7 suppression layers, AI classification, cluster correlation
RCA Deep Dive
Hypothesis tracking, evidence chains, confidence scoring, and disposition workflow
Webhook Integrations
Auto-trigger RCA from PagerDuty, Datadog, Prometheus, and 11+ platforms
Topology Explorer
Build live dependency maps for faster blast radius analysis during incidents