The Problem with Traditional RCA
Traditional approach:- Alert fires → Check dashboard → Looks fine
- SSH into servers → Grep logs → Nothing obvious
- Check database → Metrics look normal
- Call more engineers → War room starts
- 2 hours later → Find it was a downstream dependency
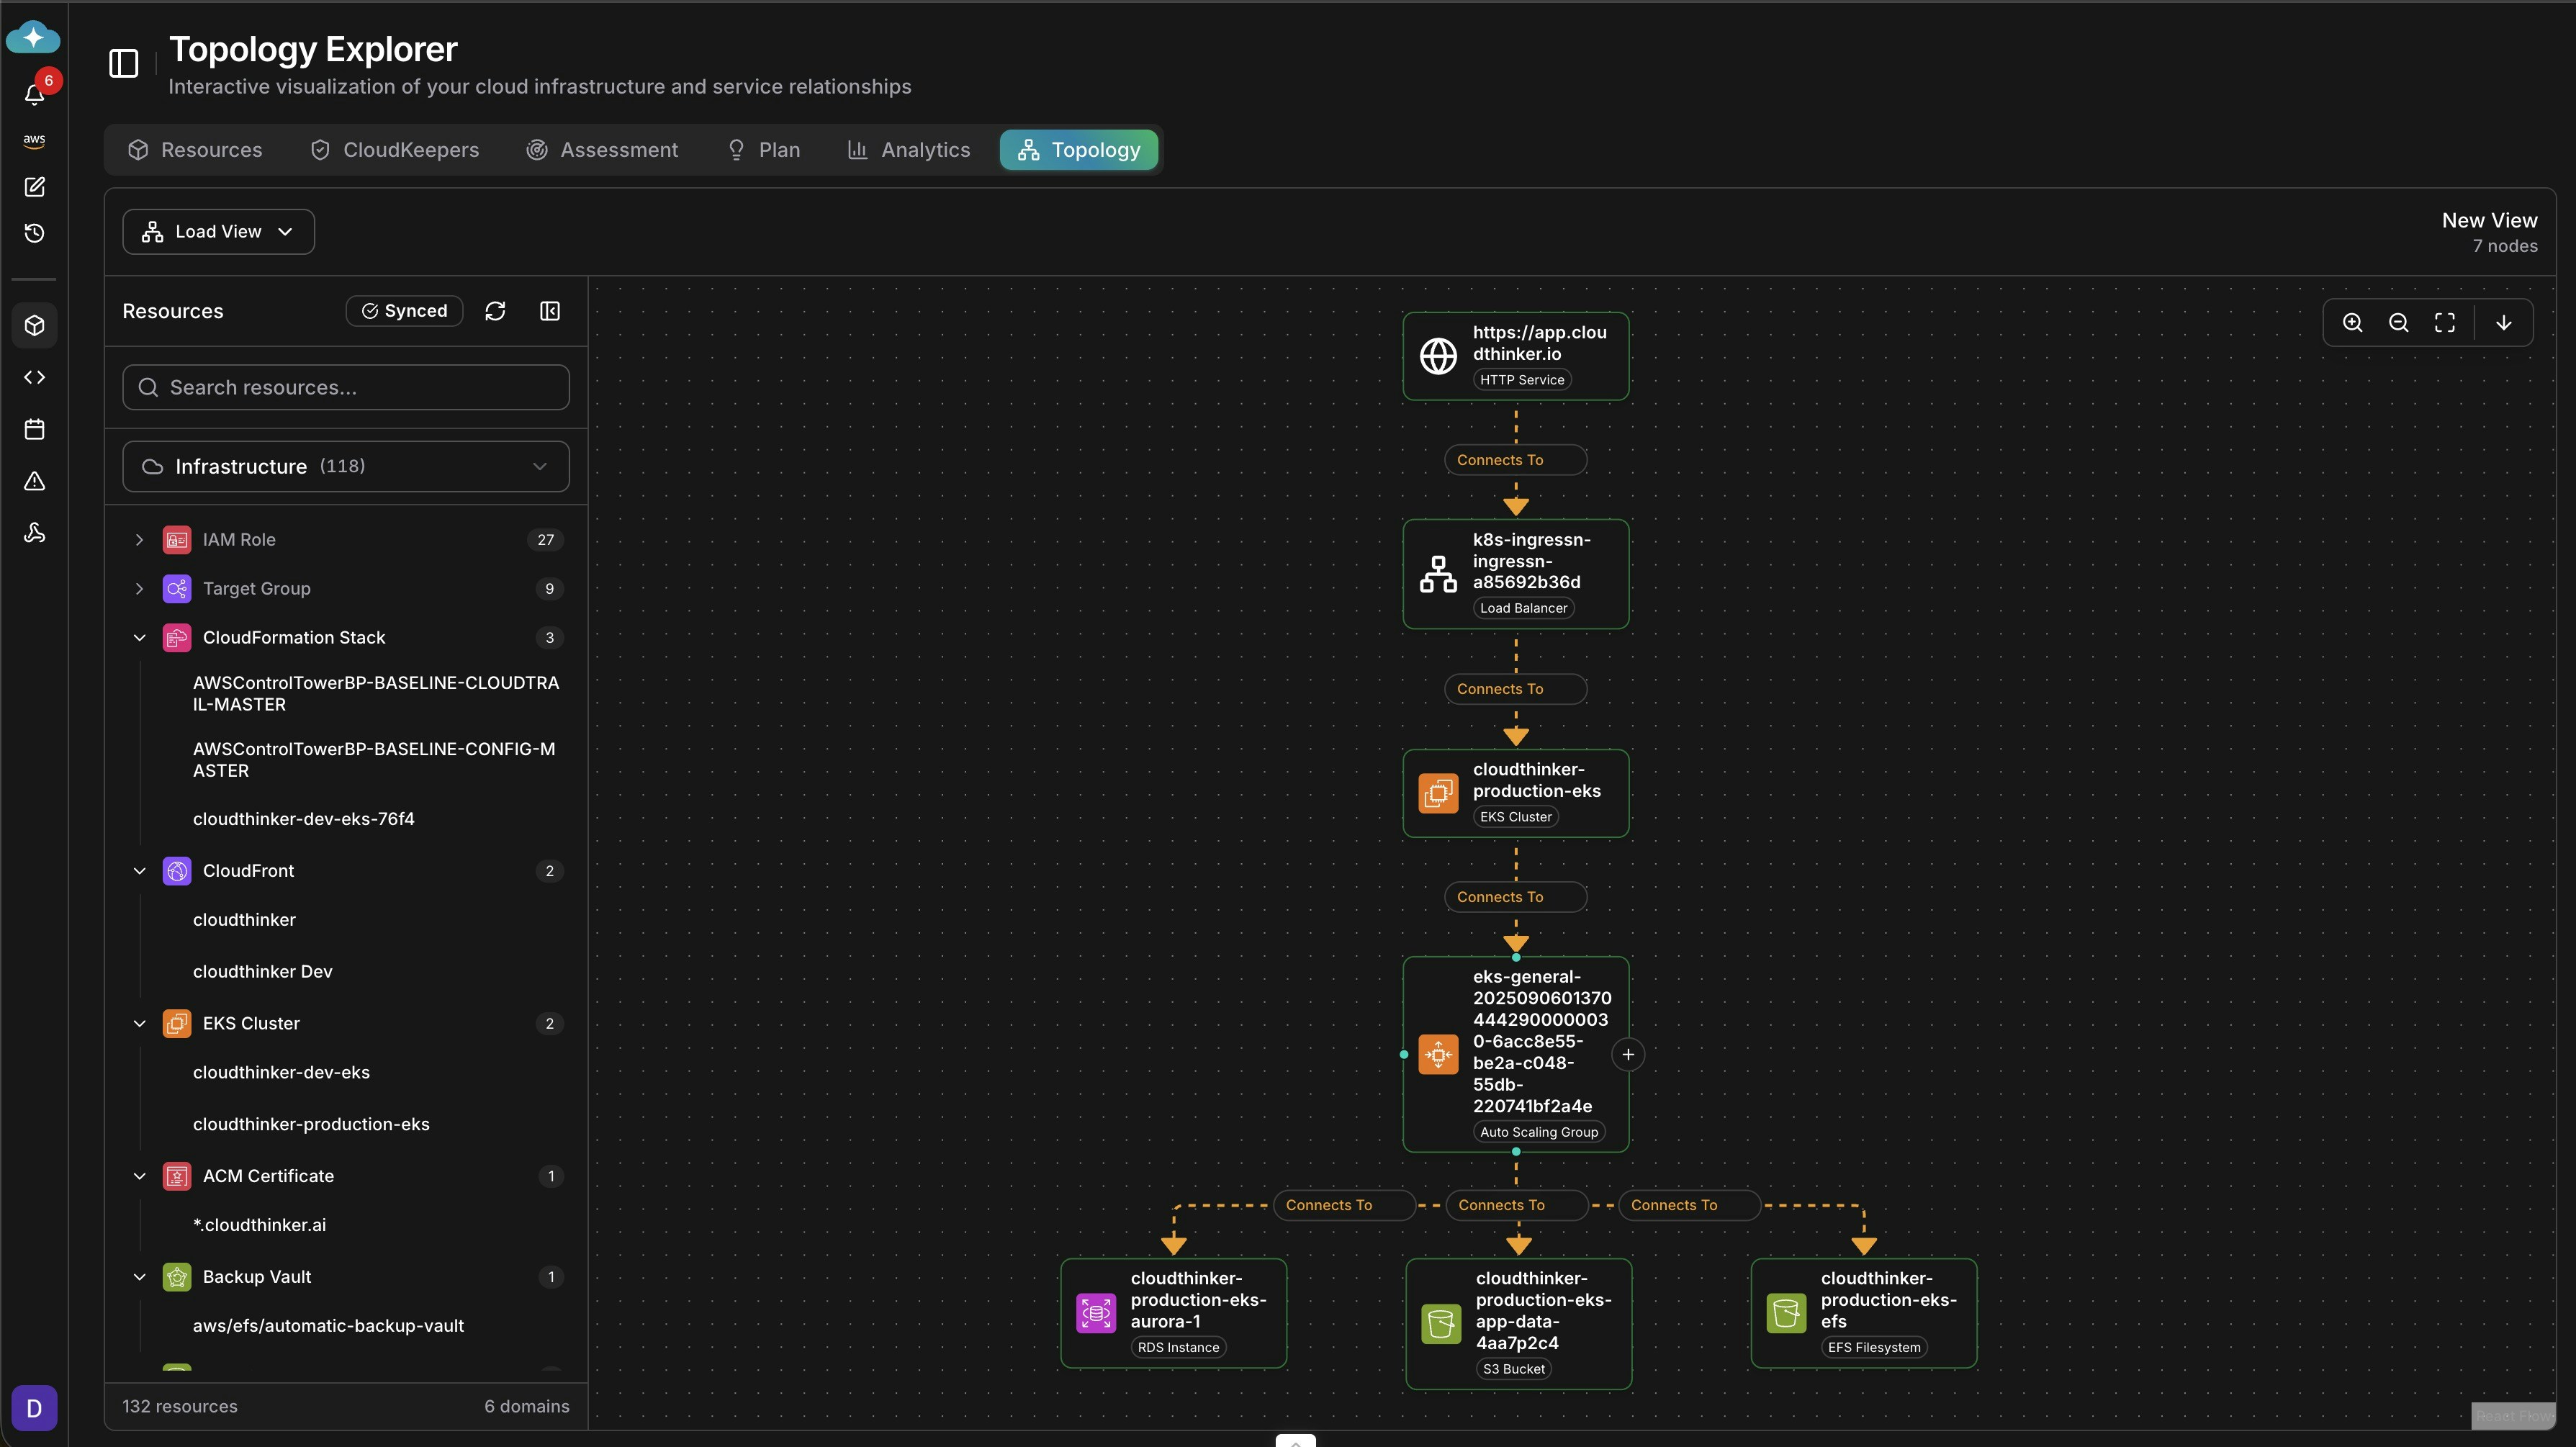
- Alert fires → Open Topology
- See the failing service highlighted in red
- Trace upstream → Find the actual root cause
- Time to resolution: 5 minutes
Real-World RCA Scenarios
Scenario 1: E-Commerce Checkout Failures
The alert: “Checkout success rate dropped to 60%” Traditional debugging:- Check checkout service logs: Some timeout errors
- Check payment service: Healthy
- Check database: CPU looks fine
- Check Redis: No errors
- 30 minutes in, still searching…
- Checkout → Payment Gateway → External API (degraded)
- Third-party payment provider having issues
- Root cause found in 2 minutes
Scenario 2: Mysterious Latency Spike
The alert: “API P99 latency exceeded 5 seconds”Scenario 3: Cascading Service Failures
The alert: “Multiple services returning 500 errors” When everything is failing, where do you start?| Time | Service | Status | Cause |
|---|---|---|---|
| 10:00:00 | Auth Service | Failed | Certificate expired |
| 10:00:05 | User Service | Failed | Can’t validate tokens |
| 10:00:08 | Order Service | Failed | Auth dependency |
| 10:00:10 | Payment Service | Failed | Auth dependency |
| 10:00:15 | All Services | Failed | Cascade complete |
Scenario 4: Database Connection Exhaustion
The alert: “PostgreSQL: too many connections”Scenario 5: Kubernetes Pod Crashloop
The alert: “Pod inventory-service in CrashLoopBackOff”- inventory-service → MongoDB (connection timeout)
- MongoDB running but network policy blocking pod
- Recent change: Security team updated network policies
Why Topology Beats Log Diving
| Aspect | Log Analysis | Topology RCA |
|---|---|---|
| Time to root cause | 30-120 minutes | 2-10 minutes |
| Expertise required | Deep system knowledge | Visual pattern recognition |
| Cross-service issues | Very difficult | Immediately visible |
| Context switching | Multiple tools/screens | Single unified view |
| Knowledge transfer | Hard to explain | Visual, shareable |
RCA Best Practices with Topology
1. Start from the Alert
2. Trace Upstream First
Most issues are caused by dependencies, not the alerting service itself.3. Overlay Metrics
Add context to your topology with real-time metrics.4. Check Recent Changes
Correlate with deployment timeline.5. Document for Postmortem
Export topology snapshots for incident documentation.Setting Up for Success
Pre-Incident Preparation
- Build your topology before incidents happen
- Connect all data sources (cloud, Kubernetes, databases)
- Set up health checks so topology shows real-time status
- Train the team on topology navigation
During Incident
- Open Topology as first response action
- Share topology view in war room
- Annotate findings in real-time
- Track resolution progress visually
Post-Incident
- Export topology snapshot for postmortem
- Document the failure path
- Identify missing monitoring
- Update runbooks with topology-based procedures
Get Started
Topology Explorer
Learn how to build and use topology maps
Infrastructure Setup
Connect your infrastructure for topology discovery
Key Takeaways
- Topology reduces MTTR from hours to minutes
- Visual RCA requires less expertise than log analysis
- Dependency mapping reveals issues traditional monitoring misses
- Pre-built topology is essential for fast incident response
- Share topology views to align teams during incidents
“We went from 2-hour war rooms to 15-minute fixes. Topology changed everything about how we do incident response.” — Platform Engineering Lead